

Scripps stock drops more than 4% after extended bearish momentum drives prices lower

E. W. Scripps Co Class A (SSP) fell 4.13% as persistent technical selling pressure continued to drive the stock lower. The move is supported by Scripps trading below all of its major moving averages and the confirmation of a downward trend across multiple timeframes.
 2.88
2.89
2.88
2.89
Highlights
- Shares of Scripps closed down 4.13% after persistent seller pressure kept the stock below key moving averages.
- Momentum and trend indicators suggest further downside risk, with oversold signals and weak trend strength prevailing.
- The expected range for the next five days is $2.79 to $3.03, with downside probability exceeding 80%.
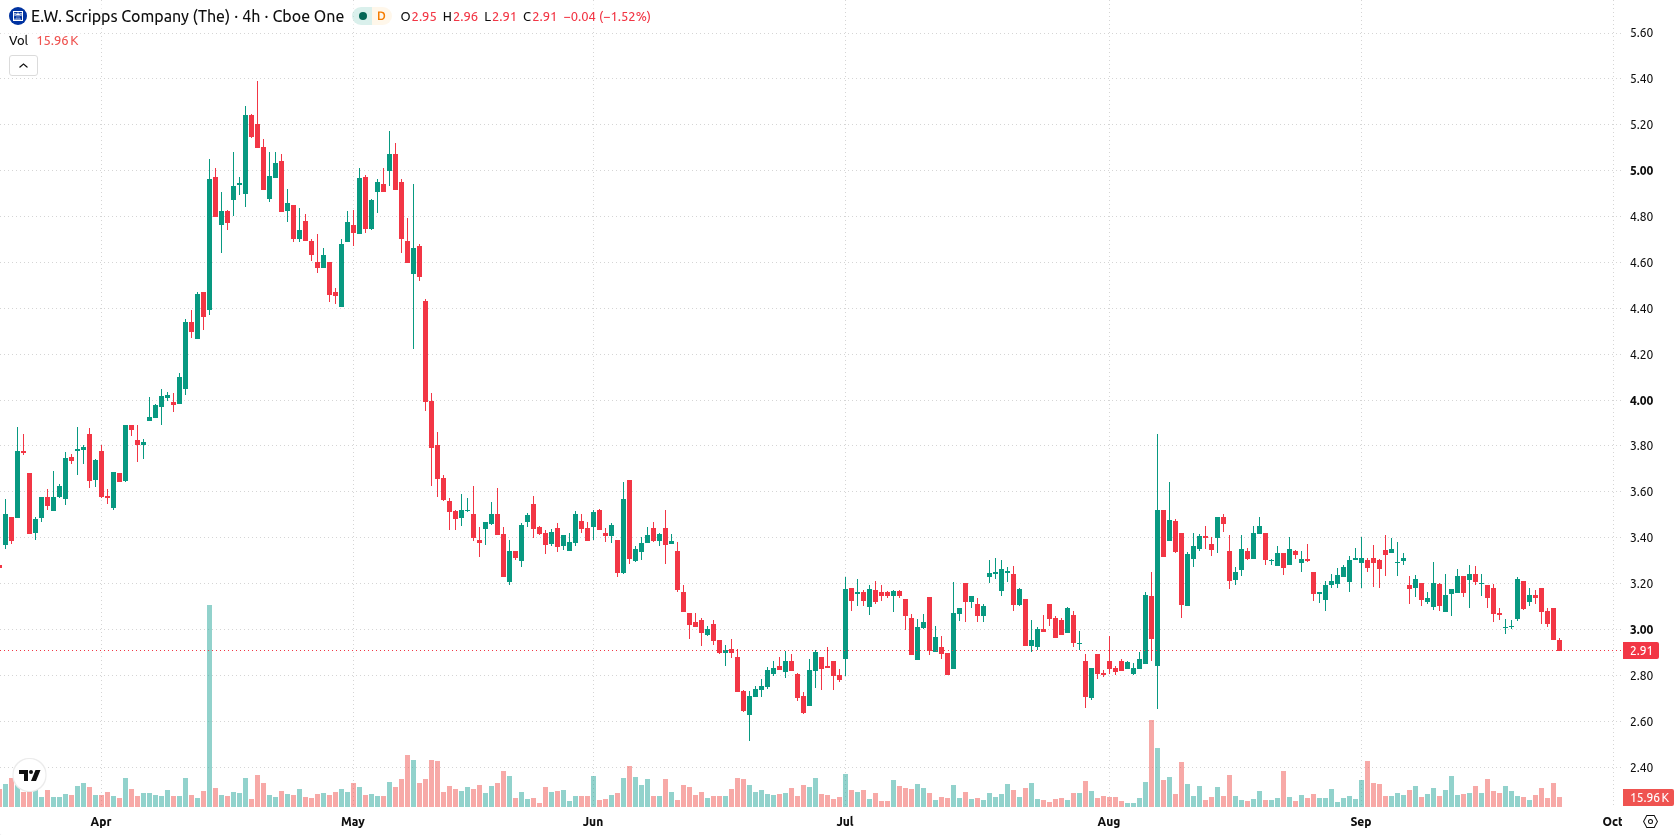
Bearish signals expand as Scripps trades beneath key averages and oversold readings build
Scripps is trading below the 20-day ($3.17), 50-day ($3.16), and 200-day ($3.62) moving averages, highlighting sustained seller pressure over the short, medium, and long terms. The near-term resistance is at $2.94, with a nearby support at $2.79, while the alignment of the 50-day and 200-day averages signals a bearish outlook. Momentum indicators are weak: the MACD is negative, the ADX sits at 9.51 (indicating a weak trend), and both the RSI (42.05) and CCI (-121.92) indicate oversold conditions, which is further corroborated by an oversold Stochastic RSI. Bull/Bear Power (BBP) is only slightly positive at 0.05, showing marginal intraday buyer involvement, but the overall momentum favors further downside. The Awesome Oscillator (AO) remains negative, and intraday movement has reflected continued pressure after the open, with current price action tracking near session lows and intraday volatility at 4.42%.
Earlier, analysts noted that Scripps was under consistent long-term bearish pressure, with technical signals indicating downside risk despite intermittent rebounds. This latest data reinforces and strengthens that view, as the alignment of major moving averages confirms ongoing weakness and traders should watch for a potential downside break below the $2.79 support.









-
 Afghanistan
-
 Albania
-
 Algeria
-
 Angola
-
 Argentina
-
 Armenia
-
 Australia
-
 Austria
-
 Azerbaijan
-
 Bahamas
-
 Bahrain
-
 Bangladesh
-
 Belarus
-
 Belgium
-
 Bolivia
-
 Botswana
-
 Brazil
-
 Brunei
-
 Bulgaria
-
 Cambodia
-
 Cameroon
-
 Canada
-
 Chile
Chile
-
 China
China
-
 Colombia
-
 Congo
Congo
-
 Costa Rica
-
 Cote d'Ivoire
-
 Croatia
-
 Cuba
Cuba
-
 Cyprus
-
 Czechia
-
 DR Congo
-
 Denmark
-
 Dominican Republic
-
 Ecuador
-
 Egypt
Egypt
-
 El Salvador
-
 Estonia
-
 Eswatini
-
 Ethiopia
-
 Finland
-
 France
-
 Georgia
-
 Germany
-
 Ghana
Ghana
-
 Greece
-
 Haiti
Haiti
-
 Hong Kong
-
 Hungary
-
 India
India
-
 Indonesia
-
 Iran, Islamic republic
-
 Iraq
Iraq
-
 Ireland
-
 Israel
-
 Italy
Italy
-
 Jamaica
-
 Japan
Japan
-
 Jordan
-
 Kazakhstan
-
 Kenya
Kenya
-
 Korea
Korea
-
 Kuwait
-
 Kyrgyzstan
-
 Laos
Laos
-
 Latvia
-
 Lebanon
-
 Lesotho
-
 Libya
Libya
-
 Lithuania
-
 Luxembourg
-
 Madagascar
-
 Malaysia
-
 Malta
Malta
-
 Mauritius
-
 Mexico
-
 Moldova
-
 Mongolia
-
 Montenegro
-
 Morocco
-
 Mozambique
-
 Myanmar
-
 Namibia
-
 Nepal
Nepal
-
 Netherlands
-
 New Zealand
-
 Nigeria
-
 North Macedonia
-
 Norway
-
 Oman
Oman
-
 Pakistan
-
 Palestine
-
 Panama
-
 Papua New Guinea
-
 Paraguay
-
 Peru
Peru
-
 Philippines
-
 Poland
-
 Portugal
-
 Puerto Rico
-
 Qatar
Qatar
-
 Reunion
-
 Romania
-
 Rwanda
-
 Saudi Arabia
-
 Serbia
-
 Singapore
-
 Slovakia
-
 Slovenia
-
 Somalia
-
 South Africa
-
 Spain
Spain
-
 Sri Lanka
-
 Sweden
-
 Switzerland
-
 Syria
Syria
-
 Taiwan
-
 Tajikistan
-
 Tanzania
-
 Thailand
-
 Trinidad and Tobago
-
 Tunisia
-
 Turkey
-
 UAE
UAE
-
 Uganda
-
 Ukraine
-
 United Kingdom
-
United States
-
 Uruguay
-
 Uzbekistan
-
 Venezuela
-
 Vietnam
-
 Yemen
Yemen
-
 Zambia
-
 Zimbabwe
- Forex
- Crypto












