


E. W. Scripps Co Class A (SSP) fell 3.38% as ongoing weakness in its Networks segment, specifically from softer direct-response advertising and recent carriage disputes, weighed on sentiment. The downside move is supported by Scripps trading below all key moving averages, indicating heavy selling pressure across timeframes.
 2.66
2.66
Highlights
- Scripps stock was cited for weak second-quarter share performance due to softness in direct-response advertising and two carriage disputes in its Networks segment.
- Industry discussion centers on the possible future benefit to Scripps financials from political advertising.
- Shares of Scripps trade below key moving averages with momentum indicators signaling oversold conditions and a projected five-day range of $2.38 to $2.68.
Carriage disputes and soft ad demand drive investor cautiousness
Recent reports highlighted that Scripps, which operates over 60 TV stations and national networks, was cited by the Gabelli Global Mini Mites Fund in its second-quarter 2026 investor letter. During the quarter, share performance was impacted by weakness in the Networks segment, driven by softer direct-response advertising and two carriage disputes. Industry discussion has also focused on the potential positive effect of political advertising on Scripps' future financial performance.
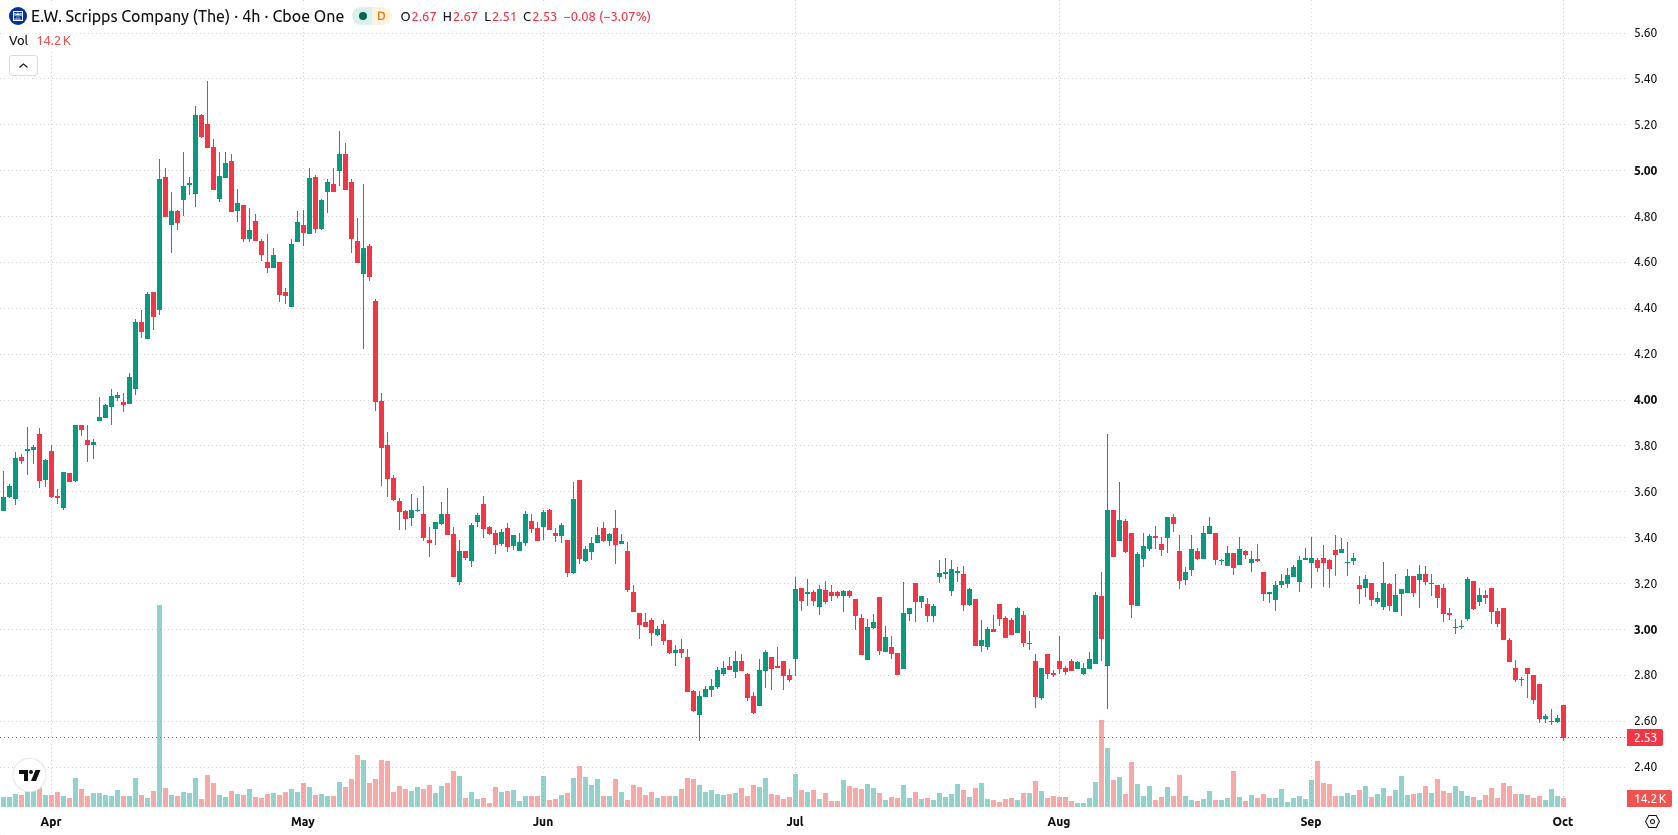
Heavy downside momentum as all major technicals confirm bearish setup
Scripps is trading below all key moving averages, with the current price of $2.53 under the MA-20 ($3.04), MA-50 ($3.11), and MA-200 ($3.57). This structure indicates sustained pressure from sellers in the short, medium, and long term, with the trend further confirmed as bearish by the MA-50 vs MA-200 alignment. Immediate resistance is at the near term ceiling of $2.58, while the near term floor stands at $2.38. Momentum signals are heavily bearish. The Moving Average Convergence Divergence (MACD) is negative and forecasts a sell, and the Average Directional Index (ADX) at 12.19 suggests a weak trend. The Relative Strength Index (RSI) reads 27.72, Commodity Channel Index (CCI) registers -184.52, and Stochastic RSI sits at 0, collectively flagging the stock as oversold. Bull/Bear Power (BBP) at -0.24 signals sellers dominate intraday, aligning with the “oversold” signals from other oscillators. The Awesome Oscillator also outputs a sell, supporting the prevailing downside move. Scripps is down $0.0884 or 3.38% on the day after opening with a small downside gap of about 0.38%, now trading near the session low with intraday volatility at 2.71%. Intraday tone remains under clear pressure, mirroring the consistent bearish momentum.
Earlier, analysts noted that Scripps was experiencing persistent bearish momentum, with technical signals indicating sustained downside risk. The latest technical and fundamental developments reinforce this outlook, with key levels to watch now centered around the $2.38 support, as a break below this threshold could trigger further declines in the near term.










-
 Afghanistan
-
 Albania
-
 Algeria
-
 Angola
-
 Argentina
-
 Armenia
-
 Australia
-
 Austria
-
 Azerbaijan
-
 Bahamas
-
 Bahrain
-
 Bangladesh
-
 Belarus
-
 Belgium
-
 Bolivia
-
 Botswana
-
 Brazil
-
 Brunei
-
 Bulgaria
-
 Cambodia
-
 Cameroon
-
 Canada
-
 Chile
-
 China
-
 Colombia
-
 Congo
-
 Costa Rica
-
 Cote d'Ivoire
-
 Croatia
-
 Cuba
-
 Cyprus
-
 Czechia
-
 DR Congo
-
 Denmark
-
 Dominican Republic
-
 Ecuador
-
 Egypt
-
 El Salvador
-
 Estonia
-
 Eswatini
-
 Ethiopia
-
 Finland
-
 France
-
 Georgia
-
 Germany
-
 Ghana
-
 Greece
-
 Haiti
-
 Hong Kong
-
 Hungary
-
 India
-
 Indonesia
-
 Iran, Islamic republic
-
 Iraq
-
 Ireland
-
 Israel
-
 Italy
-
 Jamaica
-
 Japan
-
 Jordan
-
 Kazakhstan
-
 Kenya
-
 Korea
-
 Kuwait
-
 Kyrgyzstan
-
 Laos
-
 Latvia
-
 Lebanon
-
 Lesotho
-
 Libya
-
 Lithuania
-
 Luxembourg
-
 Madagascar
-
 Malaysia
-
 Malta
-
 Mauritius
-
 Mexico
-
 Moldova
-
 Mongolia
-
 Montenegro
-
 Morocco
-
 Mozambique
-
 Myanmar
-
 Namibia
-
 Nepal
-
 Netherlands
-
 New Zealand
-
 Nigeria
-
 North Macedonia
-
 Norway
-
 Oman
-
 Pakistan
-
 Palestine
-
 Panama
-
 Papua New Guinea
-
 Paraguay
-
 Peru
-
 Philippines
-
 Poland
-
 Portugal
-
 Puerto Rico
-
 Qatar
-
 Reunion
-
 Romania
-
 Rwanda
-
 Saudi Arabia
-
 Serbia
-
 Singapore
-
 Slovakia
-
 Slovenia
-
 Somalia
-
 South Africa
-
 Spain
-
 Sri Lanka
-
 Sweden
-
 Switzerland
-
 Syria
-
 Taiwan
-
 Tajikistan
-
 Tanzania
-
 Thailand
-
 Trinidad and Tobago
-
 Tunisia
-
 Turkey
-
 UAE
-
 Uganda
-
 Ukraine
-
 United Kingdom
-
United States
-
 Uruguay
-
 Uzbekistan
-
 Venezuela
-
 Vietnam
-
 Yemen
-
 Zambia
-
 Zimbabwe
- Forex
- Crypto












