

RGTI climbs nearly 4% after short-term prices test session highs despite long-term bearish trend

Rigetti Computing, Inc. (RGTI) advanced 3.95% today on the back of strong technical momentum, with buyers dominating intraday action and the price pushing toward session highs. The move looks limited, as the stock remains below its 200-day moving average and the overall trend alignment is still bearish.
 12.60
13.83
12.60
13.83
Highlights
- Shares of Rigetti Computing trade above their 20-day and 50-day moving averages, showing short- and medium-term strength, but remain below the 200-day average.
- Multiple oscillators indicate mixed momentum with neutral trend signals and overbought intraday conditions.
- For the next five trading days, the expected price range is $16.19 to $18.05 with a 62% probability of an upward move.
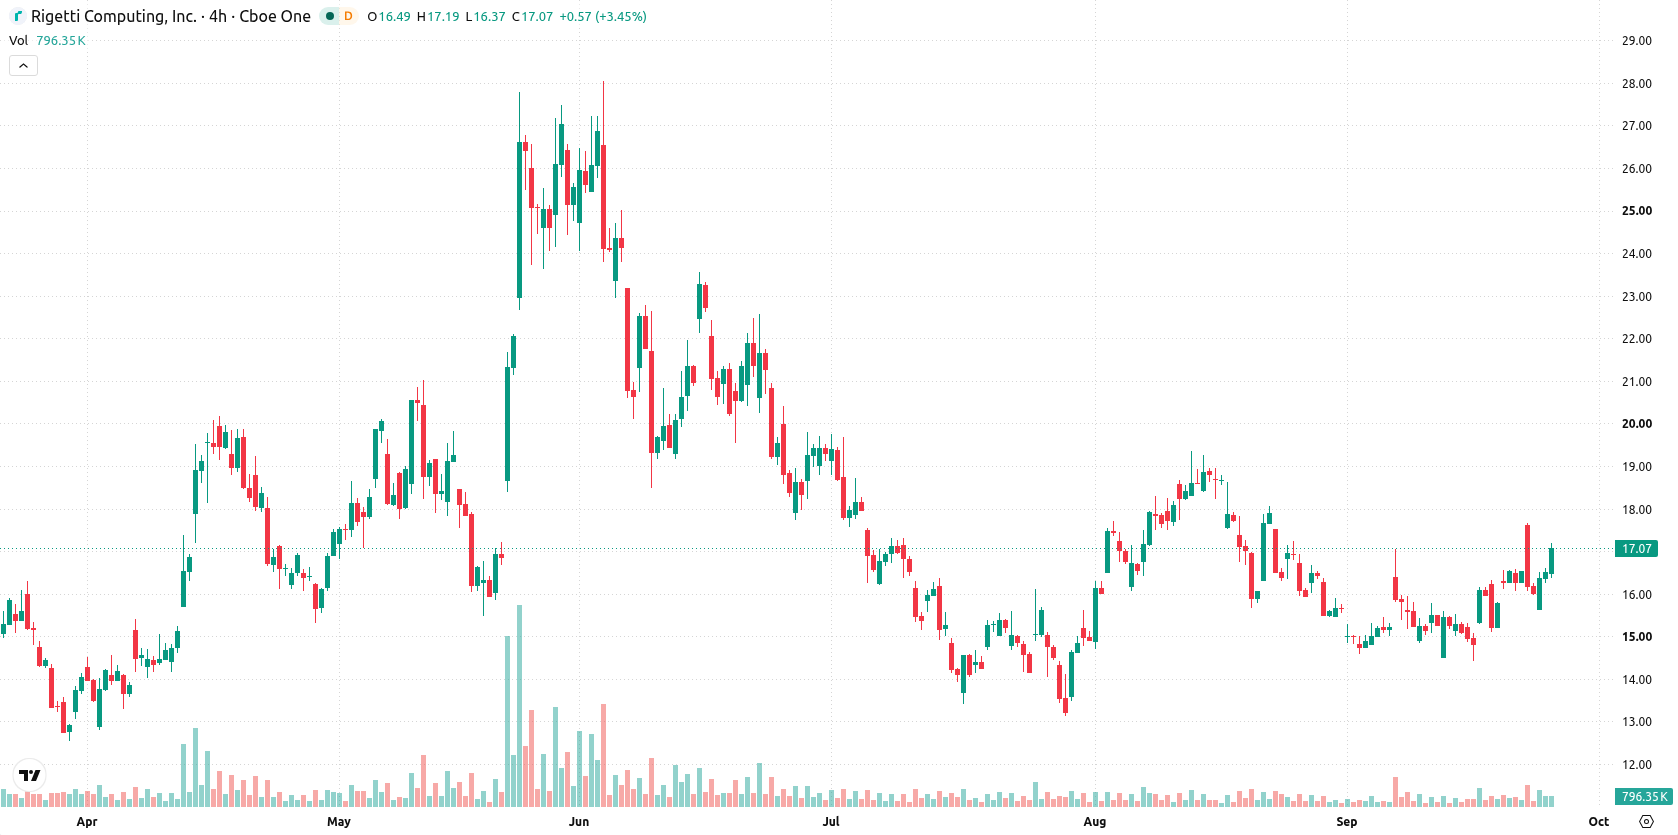
Mixed momentum as resistance and long-term pressure constrain gains
Rigetti Computing trades above both its 20-day and 50-day moving averages at $15.6 and $16, showing short- and medium-term strength. However, it remains under the 200-day average at $18.65, so the long-term trend is still pressured by sellers and overall alignment is bearish. Immediate resistance is seen at $17.56, with near-term support at $16.59. Momentum readings are mixed. The MACD is neutral and the Average Directional Index (ADX) is low, signaling a lack of strong trend. The Relative Strength Index (RSI) at 53.85 and Commodity Channel Index (CCI) at 85.57 both lean bullish, while Stochastic RSI and Bull/Bear Power highlight overbought conditions and show buyers dominating intraday. The price sits near today’s high, and intraday volatility stands at 5.67%. Several oscillators flag potential for a near-term pause.
Earlier, analysts noted that Rigetti Computing was facing ongoing technical weakness despite intermittent short-term rebounds. The current setup signals that while short- and medium-term momentum has improved, traders should monitor the $17.56 resistance as a potential pivot for any sustained breakout attempts in the coming sessions.





Latest Rigetti Computing News




-
 Afghanistan
-
 Albania
-
 Algeria
-
 Angola
-
 Argentina
-
 Armenia
-
 Australia
-
 Austria
-
 Azerbaijan
-
 Bahamas
-
 Bahrain
-
 Bangladesh
-
 Belarus
-
 Belgium
-
 Bolivia
-
 Botswana
-
 Brazil
-
 Brunei
-
 Bulgaria
-
 Cambodia
-
 Cameroon
-
 Canada
-
 Chile
Chile
-
 China
China
-
 Colombia
-
 Congo
Congo
-
 Costa Rica
-
 Cote d'Ivoire
-
 Croatia
-
 Cuba
Cuba
-
 Cyprus
-
 Czechia
-
 DR Congo
-
 Denmark
-
 Dominican Republic
-
 Ecuador
-
 Egypt
Egypt
-
 El Salvador
-
 Estonia
-
 Eswatini
-
 Ethiopia
-
 Finland
-
 France
-
 Georgia
-
 Germany
-
 Ghana
Ghana
-
 Greece
-
 Haiti
Haiti
-
 Hong Kong
-
 Hungary
-
 India
India
-
 Indonesia
-
 Iran, Islamic republic
-
 Iraq
Iraq
-
 Ireland
-
 Israel
-
 Italy
Italy
-
 Jamaica
-
 Japan
Japan
-
 Jordan
-
 Kazakhstan
-
 Kenya
Kenya
-
 Korea
Korea
-
 Kuwait
-
 Kyrgyzstan
-
 Laos
Laos
-
 Latvia
-
 Lebanon
-
 Lesotho
-
 Libya
Libya
-
 Lithuania
-
 Luxembourg
-
 Madagascar
-
 Malaysia
-
 Malta
Malta
-
 Mauritius
-
 Mexico
-
 Moldova
-
 Mongolia
-
 Montenegro
-
 Morocco
-
 Mozambique
-
 Myanmar
-
 Namibia
-
 Nepal
Nepal
-
 Netherlands
-
 New Zealand
-
 Nigeria
-
 North Macedonia
-
 Norway
-
 Oman
Oman
-
 Pakistan
-
 Palestine
-
 Panama
-
 Papua New Guinea
-
 Paraguay
-
 Peru
Peru
-
 Philippines
-
 Poland
-
 Portugal
-
 Puerto Rico
-
 Qatar
Qatar
-
 Reunion
-
 Romania
-
 Rwanda
-
 Saudi Arabia
-
 Serbia
-
 Singapore
-
 Slovakia
-
 Slovenia
-
 Somalia
-
 South Africa
-
 Spain
Spain
-
 Sri Lanka
-
 Sweden
-
 Switzerland
-
 Syria
Syria
-
 Taiwan
-
 Tajikistan
-
 Tanzania
-
 Thailand
-
 Trinidad and Tobago
-
 Tunisia
-
 Turkey
-
 UAE
UAE
-
 Uganda
-
 Ukraine
-
 United Kingdom
-
United States
-
 Uruguay
-
 Uzbekistan
-
 Venezuela
-
 Vietnam
-
 Yemen
Yemen
-
 Zambia
-
 Zimbabwe
- Forex
- Crypto












