


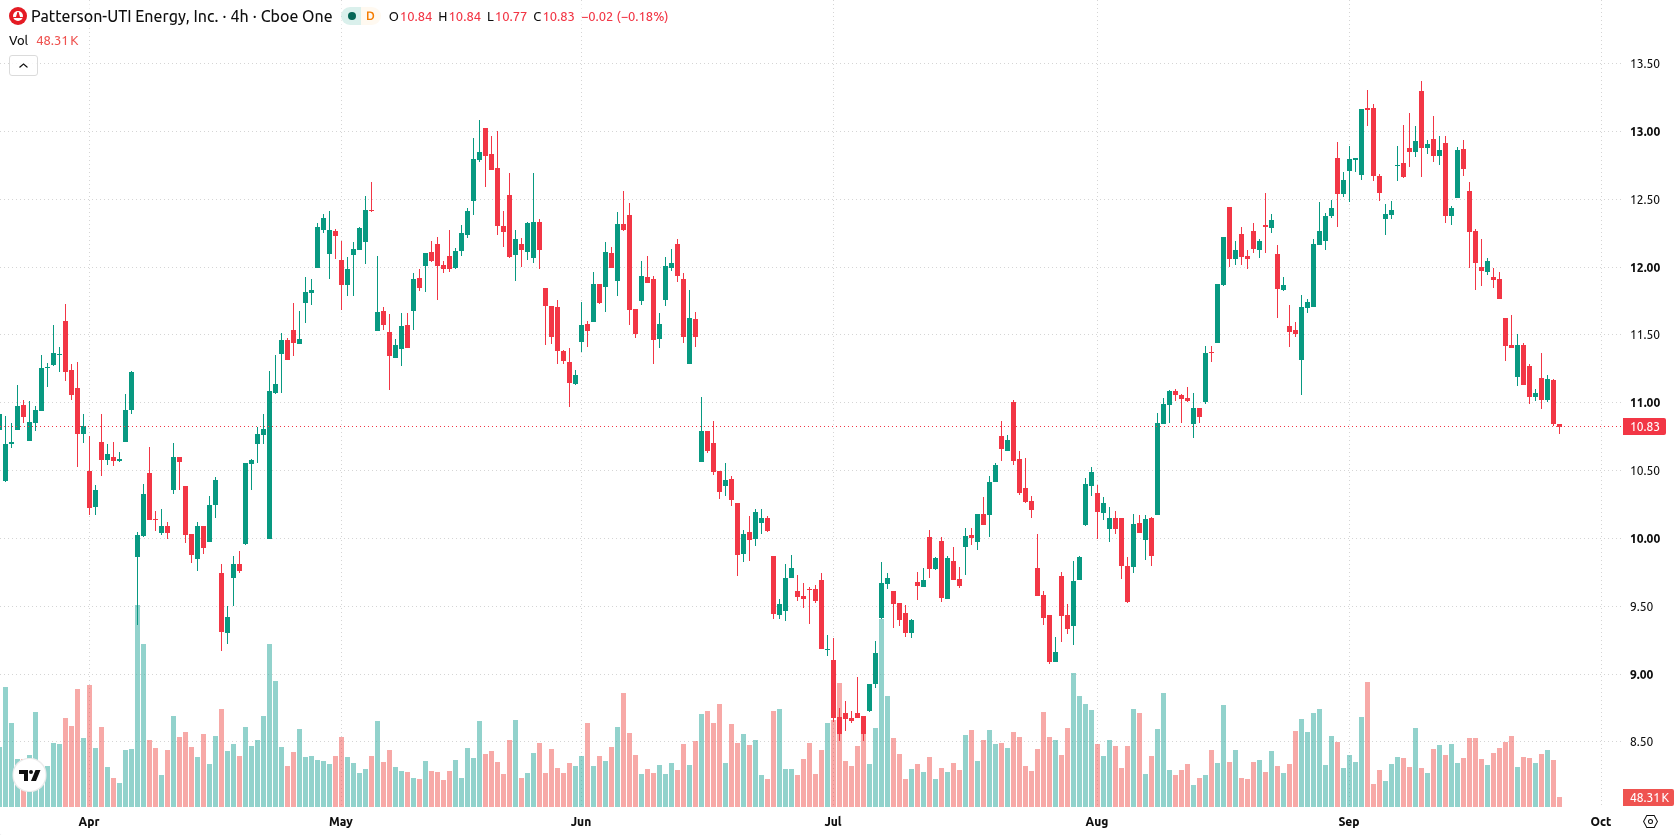
Persistent short- and medium-term selling momentum drove Patterson-UTI Energy Inc (PTEN) down 3.18% as technical pressures intensified. Deeply oversold signals from multiple oscillators suggest that the bearish move could be limited near established support levels.
 12.21
13.32
Highlights
- Shares of Patterson-UTI Energy closed at $10.83 after a 3.18% decline and remain below short- and medium-term moving averages.
- Oversold indicators, including RSI, Stochastic RSI, CCI, and Bull/Bear Power, suggest potential for near-term price stabilization.
- Next 5 trading days are forecast for sideways movement between $10.48 and $11.18 with a bearish momentum bias.
Short-term bearish bias sustained under major moving averages
Patterson-UTI Energy is trading below its 20-day ($12.27) and 50-day ($11.33) moving averages, while remaining above the 200-day ($9.88) moving average, indicating ongoing short- and medium-term selling pressure within a longer-term bullish trend. The Ichimoku Kijun at $12.12 forms distant technical resistance, with immediate price action bracketed by a near-term resistance at $10.94 and a support floor at $10.48. Neutral momentum is reflected in the MACD and ADX, while oversold signals are pronounced across the Relative Strength Index (RSI) at 40.42, Stochastic RSI at 7.36, and Commodity Channel Index (CCI) at -145.51. Intraday dynamics are dominated by sellers, as shown by a Bull/Bear Power (BBP) value of -0.43 and a downside-biased Awesome Oscillator (AO), reinforcing a bearish tone. Volatility measures at 2.01% highlight sustained price swings and persistent downward pressure.
Previously it was reported that Patterson-UTI Energy faced heightened selling pressure and increasing downside risk as technical momentum turned broadly bearish. The current analysis expands on this outlook by highlighting stronger oversold conditions and persistent volatility, underscoring $10.48 as a critical support level to watch for any further retracement.










-
 Afghanistan
-
 Albania
-
 Algeria
-
 Angola
-
 Argentina
-
 Armenia
-
 Australia
-
 Austria
-
 Azerbaijan
-
 Bahamas
-
 Bahrain
-
 Bangladesh
-
 Belarus
-
 Belgium
-
 Bolivia
-
 Botswana
-
 Brazil
-
 Brunei
-
 Bulgaria
-
 Cambodia
-
 Cameroon
-
 Canada
-
 Chile
-
 China
-
 Colombia
-
 Congo
-
 Costa Rica
-
 Cote d'Ivoire
-
 Croatia
-
 Cuba
-
 Cyprus
-
 Czechia
-
 DR Congo
-
 Denmark
-
 Dominican Republic
-
 Ecuador
-
 Egypt
-
 El Salvador
-
 Estonia
-
 Eswatini
-
 Ethiopia
-
 Finland
-
 France
-
 Georgia
-
 Germany
-
 Ghana
-
 Greece
-
 Haiti
-
 Hong Kong
-
 Hungary
-
 India
-
 Indonesia
-
 Iran, Islamic republic
-
 Iraq
-
 Ireland
-
 Israel
-
 Italy
-
 Jamaica
-
 Japan
-
 Jordan
-
 Kazakhstan
-
 Kenya
-
 Korea
-
 Kuwait
-
 Kyrgyzstan
-
 Laos
-
 Latvia
-
 Lebanon
-
 Lesotho
-
 Libya
-
 Lithuania
-
 Luxembourg
-
 Madagascar
-
 Malaysia
-
 Malta
-
 Mauritius
-
 Mexico
-
 Moldova
-
 Mongolia
-
 Montenegro
-
 Morocco
-
 Mozambique
-
 Myanmar
-
 Namibia
-
 Nepal
-
 Netherlands
-
 New Zealand
-
 Nigeria
-
 North Macedonia
-
 Norway
-
 Oman
-
 Pakistan
-
 Palestine
-
 Panama
-
 Papua New Guinea
-
 Paraguay
-
 Peru
-
 Philippines
-
 Poland
-
 Portugal
-
 Puerto Rico
-
 Qatar
-
 Reunion
-
 Romania
-
 Rwanda
-
 Saudi Arabia
-
 Serbia
-
 Singapore
-
 Slovakia
-
 Slovenia
-
 Somalia
-
 South Africa
-
 Spain
-
 Sri Lanka
-
 Sweden
-
 Switzerland
-
 Syria
-
 Taiwan
-
 Tajikistan
-
 Tanzania
-
 Thailand
-
 Trinidad and Tobago
-
 Tunisia
-
 Turkey
-
 UAE
-
 Uganda
-
 Ukraine
-
 United Kingdom
-
United States
-
 Uruguay
-
 Uzbekistan
-
 Venezuela
-
 Vietnam
-
 Yemen
-
 Zambia
-
 Zimbabwe
- Forex
- Crypto












