


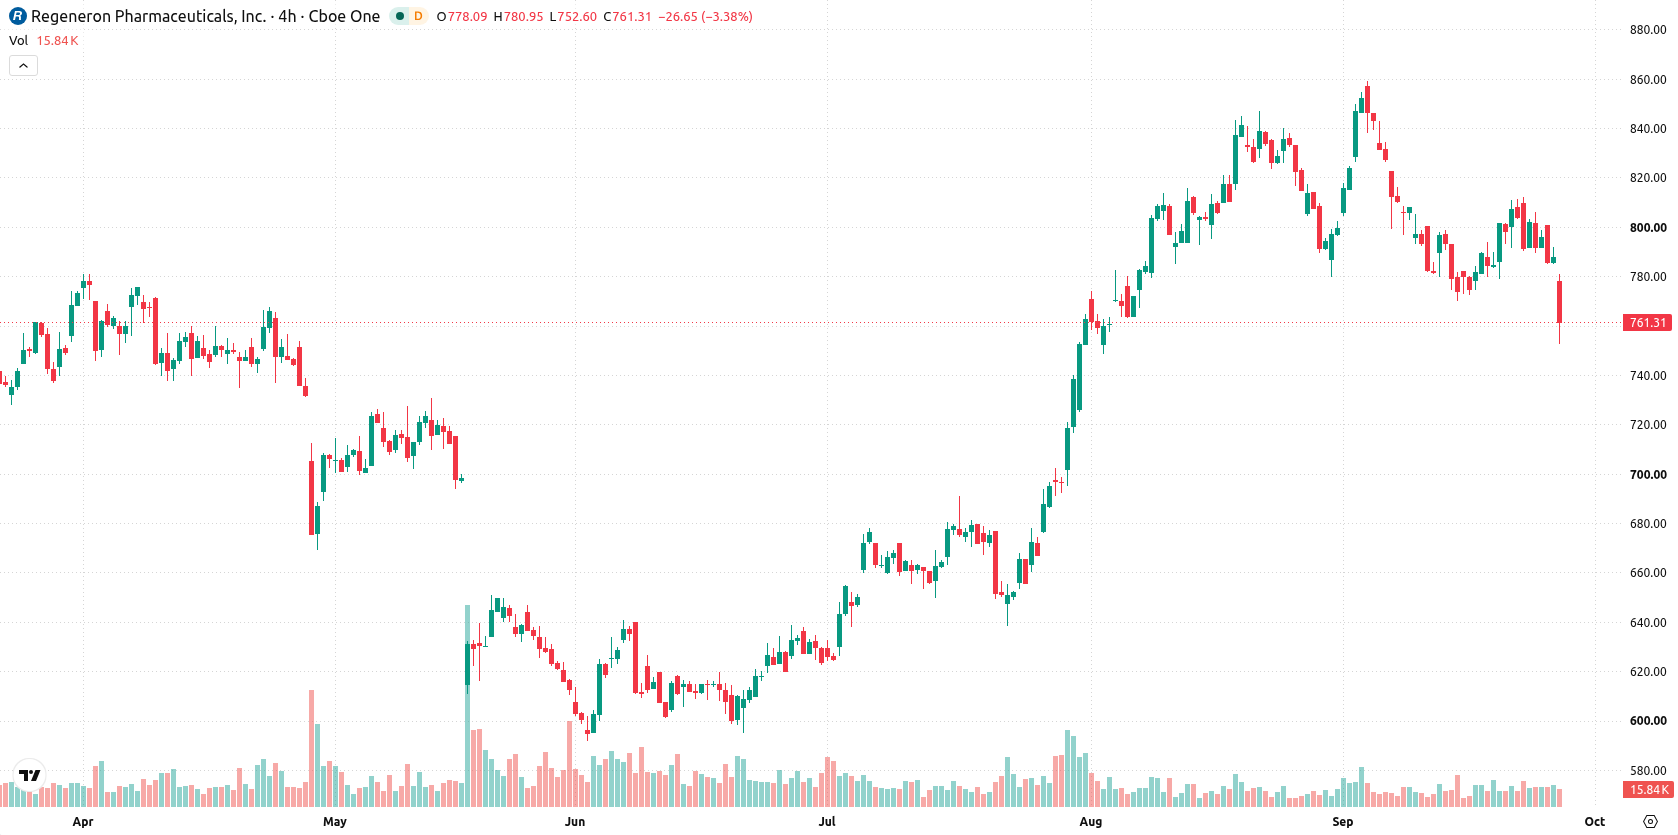
Selling pressure dominated Regeneron Pharmaceuticals, Inc. (REGN) on a sharp 3.4% drop as downside momentum took hold in the absence of fresh news catalysts. The move is supported by REGN trading below both its 20-day and 50-day moving averages, reflecting persistent short- and medium-term weakness even as the longer-term bias remains bullish above the 200-day average.
 973.63
Highlights
- Shares of Regeneron Pharmaceuticals trade below short- and medium-term moving averages, indicating ongoing selling pressure.
- Technical indicators give mixed signals with MACD and ADX showing positive momentum, while RSI, CCI, and HMA indicate downside risk.
- Over the next five trading days, shares are likely to range between $748.14 to $774.31, with a baseline scenario of sideways movement.
Mixed momentum as support holds above long-term average
Regeneron Pharmaceuticals is trading below its 20-day and 50-day moving averages ($801.79 and $776.76), indicating short- and medium-term pressure from sellers, but remains above the 200-day moving average ($735.68), which supports the longer-term bullish alignment. Immediate levels to watch are the near-term ceiling at $774.31 and the near-term floor at $748.14. Momentum readings are mixed; Moving Average Convergence Divergence (MACD) and Average Directional Index (ADX) point to positive momentum, while the Relative Strength Index (RSI), Commodity Channel Index (CCI), and Hull Moving Average (HMA) project downside risk. Sellers currently dominate intraday action as indicated by negative Bull/Bear Power (BBP) with an "Oversold" reading, and price action is near the low of today's range. The stock opened with a mild upside gap of about 0.2% but has slipped $26.81 or 3.4% to $761.23. Intraday volatility amplitude is 0.86%. The overall tone reflects continued selling pressure after the open, with oscillators and momentum signals in clear divergence.
Earlier, analysts noted that Regeneron Pharmaceuticals exhibited sustained bullish momentum, tempered by emergent regulatory and litigation risks. The current article signals a shift to short-term technical weakness, with a sideways bias likely until a decisive move occurs outside the $748.14 to $774.31 trading band.











-
 Afghanistan
-
 Albania
-
 Algeria
-
 Angola
-
 Argentina
-
 Armenia
-
 Australia
-
 Austria
-
 Azerbaijan
-
 Bahamas
-
 Bahrain
-
 Bangladesh
-
 Belarus
-
 Belgium
-
 Bolivia
-
 Botswana
-
 Brazil
-
 Brunei
-
 Bulgaria
-
 Cambodia
-
 Cameroon
-
 Canada
-
 Chile
-
 China
-
 Colombia
-
 Congo
-
 Costa Rica
-
 Cote d'Ivoire
-
 Croatia
-
 Cuba
-
 Cyprus
-
 Czechia
-
 DR Congo
-
 Denmark
-
 Dominican Republic
-
 Ecuador
-
 Egypt
-
 El Salvador
-
 Estonia
-
 Eswatini
-
 Ethiopia
-
 Finland
-
 France
-
 Georgia
-
 Germany
-
 Ghana
-
 Greece
-
 Haiti
-
 Hong Kong
-
 Hungary
-
 India
-
 Indonesia
-
 Iran, Islamic republic
-
 Iraq
-
 Ireland
-
 Israel
-
 Italy
-
 Jamaica
-
 Japan
-
 Jordan
-
 Kazakhstan
-
 Kenya
-
 Korea
-
 Kuwait
-
 Kyrgyzstan
-
 Laos
-
 Latvia
-
 Lebanon
-
 Lesotho
-
 Libya
-
 Lithuania
-
 Luxembourg
-
 Madagascar
-
 Malaysia
-
 Malta
-
 Mauritius
-
 Mexico
-
 Moldova
-
 Mongolia
-
 Montenegro
-
 Morocco
-
 Mozambique
-
 Myanmar
-
 Namibia
-
 Nepal
-
 Netherlands
-
 New Zealand
-
 Nigeria
-
 North Macedonia
-
 Norway
-
 Oman
-
 Pakistan
-
 Palestine
-
 Panama
-
 Papua New Guinea
-
 Paraguay
-
 Peru
-
 Philippines
-
 Poland
-
 Portugal
-
 Puerto Rico
-
 Qatar
-
 Reunion
-
 Romania
-
 Rwanda
-
 Saudi Arabia
-
 Serbia
-
 Singapore
-
 Slovakia
-
 Slovenia
-
 Somalia
-
 South Africa
-
 Spain
-
 Sri Lanka
-
 Sweden
-
 Switzerland
-
 Syria
-
 Taiwan
-
 Tajikistan
-
 Tanzania
-
 Thailand
-
 Trinidad and Tobago
-
 Tunisia
-
 Turkey
-
 UAE
-
 Uganda
-
 Ukraine
-
 United Kingdom
-
United States
-
 Uruguay
-
 Uzbekistan
-
 Venezuela
-
 Vietnam
-
 Yemen
-
 Zambia
-
 Zimbabwe
- Forex
- Crypto












