

JPMorgan Chase shares consolidation persists with MACD in sell territory: weekly analysis

Shares of JPMorgan Chase & Co. (JPM) are trading near $341 as support comes into focus after a stretched decline leaves the price rangebound. The week ahead is shaped by mixed technical signals, with limited momentum keeping the setup in consolidation mode and investors watching key levels for a breakout.
 345.47
346.33
Highlights
- Shares of JPMorgan Chase closed at $340.69, drifting slightly lower over the past week within an ongoing long-term uptrend.
- Bearish momentum persists with weak short-term trend strength, as the stock trades below key short- and medium-term moving averages.
- For the coming week, the expected range is $333.62 to $347.75, with $335.33 as key support and $349.07 as resistance.
Dividend hike and $50 billion buyback boost sentiment amid major partnership
JPM boosted its quarterly dividend from $1.50 to $1.65 per share on September 15, 2026, according to PR Newswire and Defense World, reinforcing shareholder returns. The company also authorized a $50 billion buyback program, as noted by Simply Wall St., which may help stabilize sentiment in the near term. Additional headlines included the Qatar Investment Authority and J.P. Morgan Asset Management signing a memorandum of understanding for a $20 billion investment partnership, as reported by Bloomberg, PR Newswire, and MarketScreener.
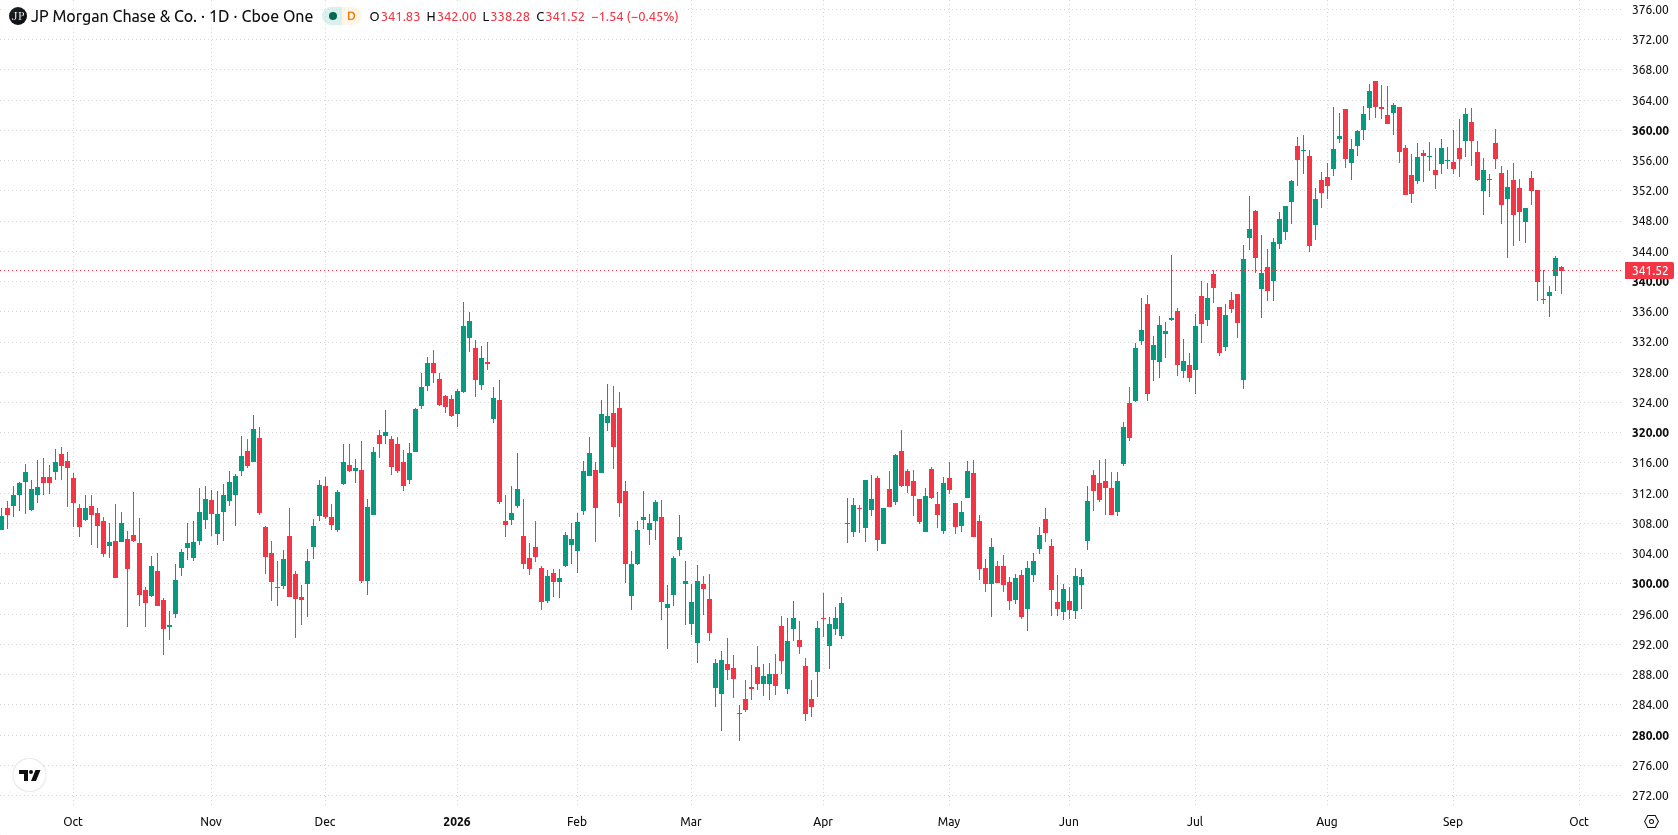
Bearish momentum lingers as consolidation holds below moving averages
On the daily chart, the broader picture shows a contained move within a narrow range, with limited trend strength and volatility at 4.71% over the week. The RSI sits in the neutral zone at 41.52, while CCI is oversold, and MACD stays in sell territory, signalling that bearish momentum persists despite some mixed signals. The nearest support stands at $335.33, while resistance comes in at $349.07, where the Ichimoku Kijun is acting as a potential ceiling. These levels will be key as the stock consolidates below its key moving averages.
Neutral bias dominates as breakout hinges on support and resistance tests
For the coming trading week, the expected range is $333.62 to $347.75. There is a 52% probability of an increase and a 48% chance of a decrease. The base case sees consolidation between $335.33 and $349.07. A sustained move above $349.07 could open room for further upside, while a drop below $335.33 would point to renewed downside pressure.
Earlier, analysts noted that major banks reaffirmed positive long-term outlooks for leading financial stocks, citing strategic initiatives and consistent earnings performance. The current technical setup for JPMorgan adds a layer of caution around near-term direction, making the $335.33 and $349.07 levels critical reference points for monitoring a potential breakout or renewed downside.






Latest JPMorgan Chase News





-
 Afghanistan
-
 Albania
-
 Algeria
-
 Angola
-
 Argentina
-
 Armenia
-
 Australia
-
 Austria
-
 Azerbaijan
-
 Bahamas
-
 Bahrain
-
 Bangladesh
-
 Belarus
-
 Belgium
-
 Bolivia
-
 Botswana
-
 Brazil
-
 Brunei
-
 Bulgaria
-
 Cambodia
-
 Cameroon
-
 Canada
-
 Chile
-
 China
-
 Colombia
-
 Congo
-
 Costa Rica
-
 Cote d'Ivoire
-
 Croatia
-
 Cuba
-
 Cyprus
-
 Czechia
-
 DR Congo
-
 Denmark
-
 Dominican Republic
-
 Ecuador
-
 Egypt
-
 El Salvador
-
 Estonia
-
 Eswatini
-
 Ethiopia
-
 Finland
-
 France
-
 Georgia
-
 Germany
-
 Ghana
-
 Greece
-
 Haiti
-
 Hong Kong
-
 Hungary
-
 India
-
 Indonesia
-
 Iran, Islamic republic
-
 Iraq
-
 Ireland
-
 Israel
-
 Italy
-
 Jamaica
-
 Japan
-
 Jordan
-
 Kazakhstan
-
 Kenya
-
 Korea
-
 Kuwait
-
 Kyrgyzstan
-
 Laos
-
 Latvia
-
 Lebanon
-
 Lesotho
-
 Libya
-
 Lithuania
-
 Luxembourg
-
 Madagascar
-
 Malaysia
-
 Malta
-
 Mauritius
-
 Mexico
-
 Moldova
-
 Mongolia
-
 Montenegro
-
 Morocco
-
 Mozambique
-
 Myanmar
-
 Namibia
-
 Nepal
-
 Netherlands
-
 New Zealand
-
 Nigeria
-
 North Macedonia
-
 Norway
-
 Oman
-
 Pakistan
-
 Palestine
-
 Panama
-
 Papua New Guinea
-
 Paraguay
-
 Peru
-
 Philippines
-
 Poland
-
 Portugal
-
 Puerto Rico
-
 Qatar
-
 Reunion
-
 Romania
-
 Rwanda
-
 Saudi Arabia
-
 Serbia
-
 Singapore
-
 Slovakia
-
 Slovenia
-
 Somalia
-
 South Africa
-
 Spain
-
 Sri Lanka
-
 Sweden
-
 Switzerland
-
 Syria
-
 Taiwan
-
 Tajikistan
-
 Tanzania
-
 Thailand
-
 Trinidad and Tobago
-
 Tunisia
-
 Turkey
-
 UAE
-
 Uganda
-
 Ukraine
-
 United Kingdom
-
United States
-
 Uruguay
-
 Uzbekistan
-
 Venezuela
-
 Vietnam
-
 Yemen
-
 Zambia
-
 Zimbabwe
- Forex
- Crypto












