

Support pressure at $1.61: Can Bit Digital stock avoid deeper losses?

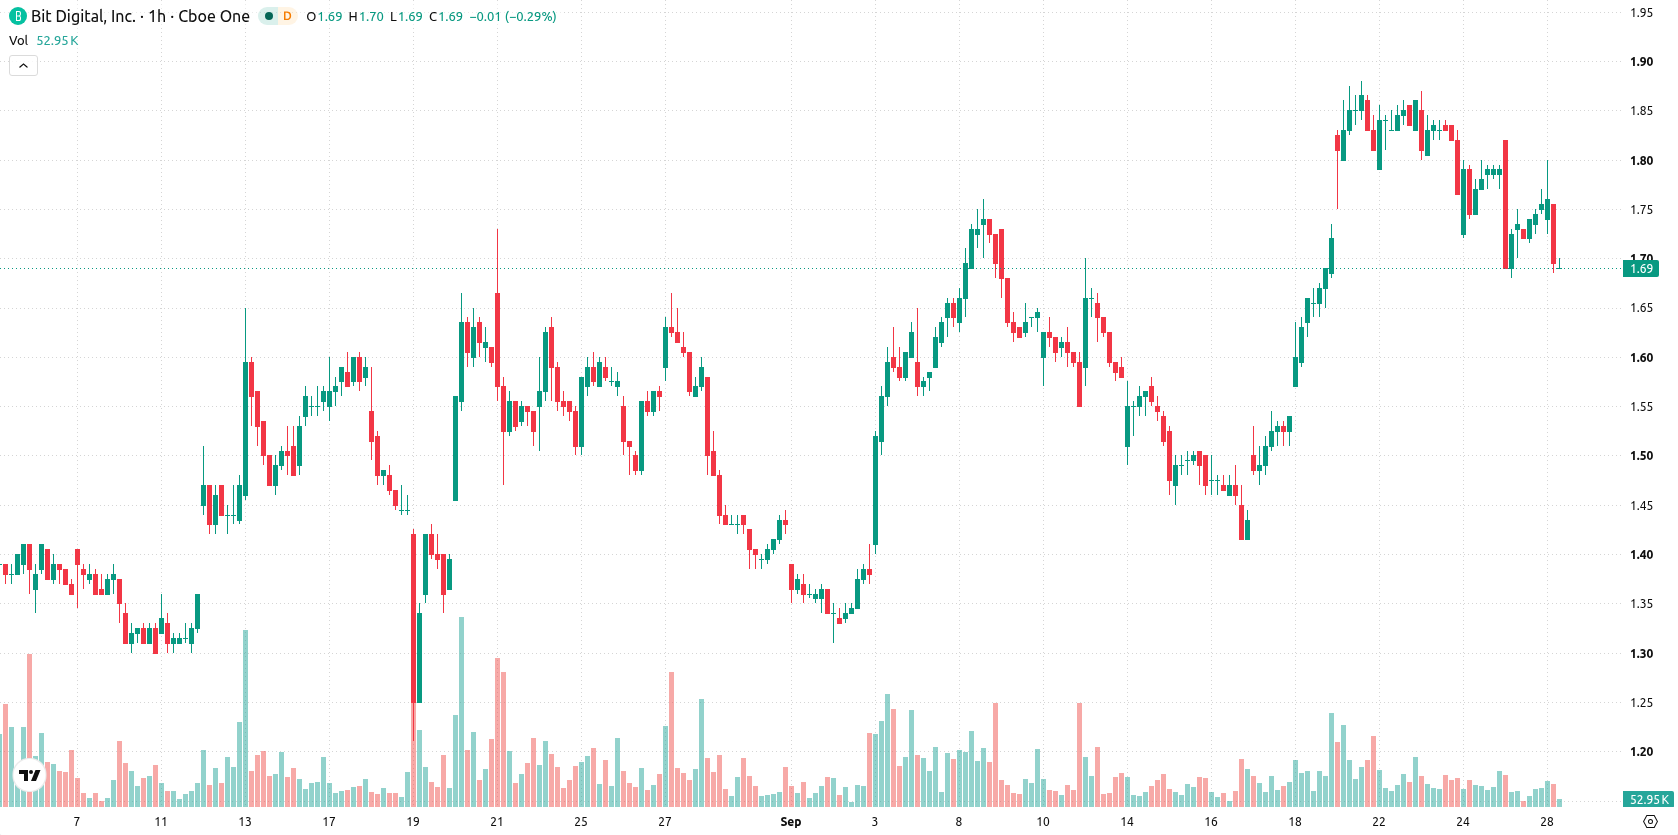
Bit Digital (BTBT) stock is trading at $1.69, down 3.49% on the day. BTBT remains below its key moving averages, reflecting ongoing negative momentum.
 0.7549
0.8749
Highlights
- BTBT/USD trades below all major moving averages on high volatility, with bearish momentum dominating across timeframes.
- Downward pressure persists as key indicators including MACD and ADX remain negative, though intraday buyer strength is present.
- Price is expected to fluctuate between $1.61 and $1.77 in the next 2 to 3 days, with a 40% chance of an upward move.
Bearish bias as resistance holds and volatility diverges from trend
On the hourly chart, BTBT is trading below the MA-20, MA-50, and remains under the long-term MA-200. The Ichimoku Kijun at $1.78 is acting as immediate resistance. MACD and ADX both indicate continued bearish momentum, while RSI reads neutral at 49.95 but issues a Sell signal. Stochastic RSI is overbought, which may lead to a temporary pause in the current decline. CCI is neutral, and the Awesome Oscillator does not show a clear signal. Bull/Bear Power reflects strong intraday buying, which diverges from the generally bearish backdrop, highlighting notable intraday volatility.
Sideways range as breakout triggers define near-term direction
Over the next two to three trading days, BTBT/USD is expected to fluctuate within a band between $1.61 and $1.77. There is a 40% probability of an upward move, suggesting the most likely scenario is continued sideways action inside this volatility corridor. A bullish scenario would require a breakout above the $1.78 resistance level, while a bearish scenario could play out if price falls through support at $1.61.
Earlier, analysts noted that Bit Digital was facing downside risk amid a narrow consolidation, with technical signals emphasizing the importance of monitoring key support and resistance levels for further direction. The current analysis reinforces this outlook as persistent negative momentum and continued trading below major moving averages keep the focus on potential price action around the $1.61 support and $1.78 resistance as pivotal markers for the next move.






Latest Bit Digital News



-
 Afghanistan
-
 Albania
-
 Algeria
-
 Angola
-
 Argentina
-
 Armenia
-
 Australia
-
 Austria
-
 Azerbaijan
-
 Bahamas
-
 Bahrain
-
 Bangladesh
-
 Belarus
-
 Belgium
-
 Bolivia
-
 Botswana
-
 Brazil
-
 Brunei
-
 Bulgaria
-
 Cambodia
-
 Cameroon
-
 Canada
-
 Chile
-
 China
-
 Colombia
-
 Congo
-
 Costa Rica
-
 Cote d'Ivoire
-
 Croatia
-
 Cuba
-
 Cyprus
-
 Czechia
-
 DR Congo
-
 Denmark
-
 Dominican Republic
-
 Ecuador
-
 Egypt
-
 El Salvador
-
 Estonia
-
 Eswatini
-
 Ethiopia
-
 Finland
-
 France
-
 Georgia
-
 Germany
-
 Ghana
-
 Greece
-
 Haiti
-
 Hong Kong
-
 Hungary
-
 India
-
 Indonesia
-
 Iran, Islamic republic
-
 Iraq
-
 Ireland
-
 Israel
-
 Italy
-
 Jamaica
-
 Japan
-
 Jordan
-
 Kazakhstan
-
 Kenya
-
 Korea
-
 Kuwait
-
 Kyrgyzstan
-
 Laos
-
 Latvia
-
 Lebanon
-
 Lesotho
-
 Libya
-
 Lithuania
-
 Luxembourg
-
 Madagascar
-
 Malaysia
-
 Malta
-
 Mauritius
-
 Mexico
-
 Moldova
-
 Mongolia
-
 Montenegro
-
 Morocco
-
 Mozambique
-
 Myanmar
-
 Namibia
-
 Nepal
-
 Netherlands
-
 New Zealand
-
 Nigeria
-
 North Macedonia
-
 Norway
-
 Oman
-
 Pakistan
-
 Palestine
-
 Panama
-
 Papua New Guinea
-
 Paraguay
-
 Peru
-
 Philippines
-
 Poland
-
 Portugal
-
 Puerto Rico
-
 Qatar
-
 Reunion
-
 Romania
-
 Rwanda
-
 Saudi Arabia
-
 Serbia
-
 Singapore
-
 Slovakia
-
 Slovenia
-
 Somalia
-
 South Africa
-
 Spain
-
 Sri Lanka
-
 Sweden
-
 Switzerland
-
 Syria
-
 Taiwan
-
 Tajikistan
-
 Tanzania
-
 Thailand
-
 Trinidad and Tobago
-
 Tunisia
-
 Turkey
-
 UAE
-
 Uganda
-
 Ukraine
-
 United Kingdom
-
United States
-
 Uruguay
-
 Uzbekistan
-
 Venezuela
-
 Vietnam
-
 Yemen
-
 Zambia
-
 Zimbabwe
- Forex
- Crypto












