

Bakkt stock forecast: Recovery attempt as sellers lose momentum

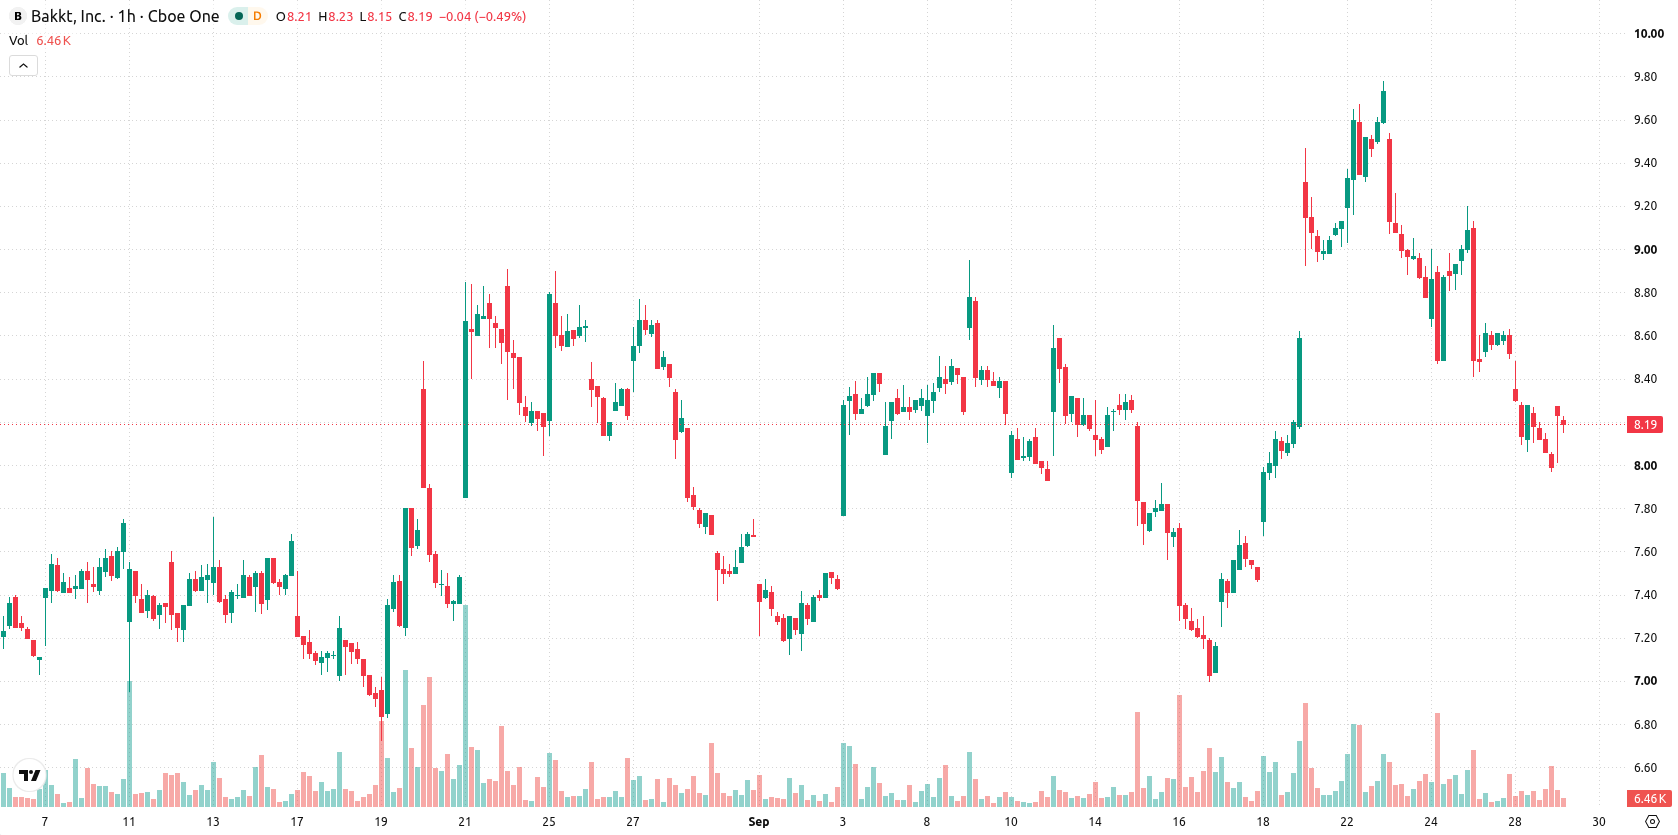
Bakkt (BKKT) stock is trading at $8.18, gaining 2.25% today with a move that leaves shares positioned below their key moving averages. The price sits mid-range intra-day, pointing to high volatility and a short-term bounce against a backdrop of multi-timeframe weakness.
 4.66
5.33
Highlights
- BKKT stock trades below short, medium, and long-term moving averages, indicating sustained seller dominance across all timeframes.
- Bearish momentum prevails, with MACD issuing a sell signal and multiple momentum indicators showing oversold conditions, though a short-term bounce is possible.
- BKKT closed at $8.18 with high intraday volatility and is expected to range between $7.49 to $8.87, with a 71% probability of further decline.
Technical resistance holds as bearish momentum dominates
BKKT is trading below the MA-20 ($8.5) and MA-50 ($8.73) on the hourly chart, as well as below the long-term MA-200 at $9.66 on the daily timeframe. The immediate resistance level is defined by the Ichimoku Kijun at $8.58. Momentum indicators provide further context: MACD signals Sell, ADX is Neutral, while RSI at 33.55, together with Stochastic RSI and CCI readings, suggest oversold conditions. Bull/Bear Power indicates sellers are dominating intraday action, and the Awesome Oscillator confirms alignment with the ongoing downtrend.
Downside risk grows as breakout triggers remain elusive
Over the next 2–3 trading days, price is expected to fluctuate within a $7.49–$8.87 volatility band relative to current levels. The probability of an upward move is 29%, while further decline carries a 71% probability; hence, an upward move remains less likely. Baseline scenario anticipates sideways trading inside this range, while a breakout above $8.58 would mark a bullish trigger, and a drop below $7.49 would significantly increase downside risk.
Earlier, analysts noted that Bakkt was experiencing persistent bearish momentum despite some signs of short-term buying interest. This update strengthens the prevailing downtrend narrative, highlighting the importance of watching for a sustained move above $8.58 or a decisive break below $7.49 as catalysts for the next directional shift.






Latest Bakkt News



-
 Afghanistan
-
 Albania
-
 Algeria
-
 Angola
-
 Argentina
-
 Armenia
-
 Australia
-
 Austria
-
 Azerbaijan
-
 Bahamas
-
 Bahrain
-
 Bangladesh
-
 Belarus
-
 Belgium
-
 Bolivia
-
 Botswana
-
 Brazil
-
 Brunei
-
 Bulgaria
-
 Cambodia
-
 Cameroon
-
 Canada
-
 Chile
-
 China
-
 Colombia
-
 Congo
-
 Costa Rica
-
 Cote d'Ivoire
-
 Croatia
-
 Cuba
-
 Cyprus
-
 Czechia
-
 DR Congo
-
 Denmark
-
 Dominican Republic
-
 Ecuador
-
 Egypt
-
 El Salvador
-
 Estonia
-
 Eswatini
-
 Ethiopia
-
 Finland
-
 France
-
 Georgia
-
 Germany
-
 Ghana
-
 Greece
-
 Haiti
-
 Hong Kong
-
 Hungary
-
 India
-
 Indonesia
-
 Iran, Islamic republic
-
 Iraq
-
 Ireland
-
 Israel
-
 Italy
-
 Jamaica
-
 Japan
-
 Jordan
-
 Kazakhstan
-
 Kenya
-
 Korea
-
 Kuwait
-
 Kyrgyzstan
-
 Laos
-
 Latvia
-
 Lebanon
-
 Lesotho
-
 Libya
-
 Lithuania
-
 Luxembourg
-
 Madagascar
-
 Malaysia
-
 Malta
-
 Mauritius
-
 Mexico
-
 Moldova
-
 Mongolia
-
 Montenegro
-
 Morocco
-
 Mozambique
-
 Myanmar
-
 Namibia
-
 Nepal
-
 Netherlands
-
 New Zealand
-
 Nigeria
-
 North Macedonia
-
 Norway
-
 Oman
-
 Pakistan
-
 Palestine
-
 Panama
-
 Papua New Guinea
-
 Paraguay
-
 Peru
-
 Philippines
-
 Poland
-
 Portugal
-
 Puerto Rico
-
 Qatar
-
 Reunion
-
 Romania
-
 Rwanda
-
 Saudi Arabia
-
 Serbia
-
 Singapore
-
 Slovakia
-
 Slovenia
-
 Somalia
-
 South Africa
-
 Spain
-
 Sri Lanka
-
 Sweden
-
 Switzerland
-
 Syria
-
 Taiwan
-
 Tajikistan
-
 Tanzania
-
 Thailand
-
 Trinidad and Tobago
-
 Tunisia
-
 Turkey
-
 UAE
-
 Uganda
-
 Ukraine
-
 United Kingdom
-
United States
-
 Uruguay
-
 Uzbekistan
-
 Venezuela
-
 Vietnam
-
 Yemen
-
 Zambia
-
 Zimbabwe
- Forex
- Crypto












