


Walmart Inc. (WMT) fell 2.76% today as selling pressure intensified, even as recent news highlighted growth in online sales, membership fees, and a raised full-year profit forecast. The down move is reinforced as the stock remains below key moving averages with resistance levels capping rebound attempts.
 126.64
131.69
Highlights
- Walmart stock fell 2.76% to $105.73 as the company raised its full-year profit outlook to $2.80 to $2.87 per share and grew membership fee revenue by 17%.
- Online sales climbed 23% globally and Walmart expanded its store footprint with smaller locations and enhanced services, while clarifying it will not pursue AI-driven or personalized pricing.
- Shares trade below key moving averages with mixed momentum indicator signals and are expected to range between $103.44 to $109.04 in the next five days.
ETF purchases and profit outlook overshadowed by persistent price weakness
Walmart reported $42.9 million in net ETF purchases and continued to expand its earnings base from membership fees at Walmart+ and Sam’s Club. The company focused on opening smaller-format Neighborhood Market stores to increase grocery traffic and enhanced pickup, delivery, and pharmacy services. CEO John Furner stated that Walmart will not use AI or personal data for dynamic or personalized pricing, clarifying its approach to digital pricing technology. Online sales increased 23% globally and membership fees rose 17%. The company also raised its full-year profit forecast to $2.80 to $2.87 per share, though price action has remained under broader selling pressure.
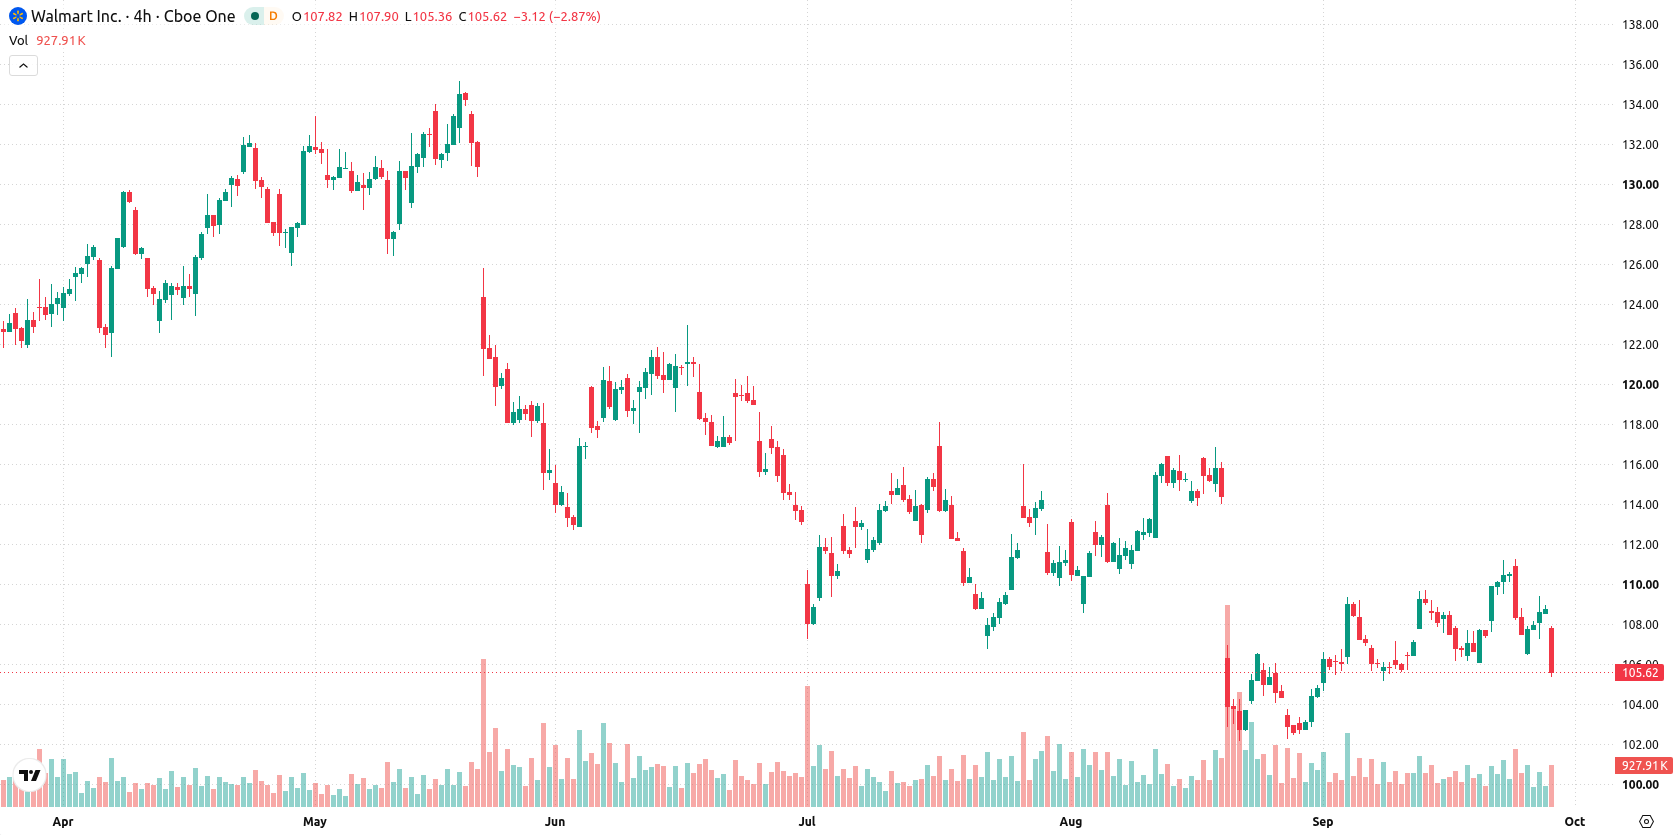
Negative downtrend sustained as mixed momentum signals flag caution
Walmart is trading below its 20-day, 50-day, and 200-day moving averages ($107.38, $109.27, and $118.54 respectively), indicating definitive short-, medium-, and long-term downtrends. The nearest resistance is at the weekly low of $106.62, with support at $103.44. The Ichimoku Kijun ($106.74) acts as resistance, and the bearish configuration of the 50- and 200-day moving averages confirms a negative longer-term bias. Momentum signals are mixed: the MACD and ADX indicate neutral momentum, while RSI, Stochastic RSI, CCI, and AO all show a cautious long-side bias. Bull/Bear Power (BBP) remains positive at 1.37, suggesting buyers are present intraday but conditions are overbought. The stock is currently near the session low with mild intraday volatility, and persistent selling pressure aligns with weak directional momentum.
In a recent review, analysts highlighted Walmart’s appeal based on its scale, growing membership base, and comparatively attractive valuation versus other retail giants. The current technical setup, with WMT consolidating near support, suggests traders should closely watch for a decisive move above $106.62 or below $103.44 to confirm the next directional trend.











-
 Afghanistan
-
 Albania
-
 Algeria
-
 Angola
-
 Argentina
-
 Armenia
-
 Australia
-
 Austria
-
 Azerbaijan
-
 Bahamas
-
 Bahrain
-
 Bangladesh
-
 Belarus
-
 Belgium
-
 Bolivia
-
 Botswana
-
 Brazil
-
 Brunei
-
 Bulgaria
-
 Cambodia
-
 Cameroon
-
 Canada
-
 Chile
-
 China
-
 Colombia
-
 Congo
-
 Costa Rica
-
 Cote d'Ivoire
-
 Croatia
-
 Cuba
-
 Cyprus
-
 Czechia
-
 DR Congo
-
 Denmark
-
 Dominican Republic
-
 Ecuador
-
 Egypt
-
 El Salvador
-
 Estonia
-
 Eswatini
-
 Ethiopia
-
 Finland
-
 France
-
 Georgia
-
 Germany
-
 Ghana
-
 Greece
-
 Haiti
-
 Hong Kong
-
 Hungary
-
 India
-
 Indonesia
-
 Iran, Islamic republic
-
 Iraq
-
 Ireland
-
 Israel
-
 Italy
-
 Jamaica
-
 Japan
-
 Jordan
-
 Kazakhstan
-
 Kenya
-
 Korea
-
 Kuwait
-
 Kyrgyzstan
-
 Laos
-
 Latvia
-
 Lebanon
-
 Lesotho
-
 Libya
-
 Lithuania
-
 Luxembourg
-
 Madagascar
-
 Malaysia
-
 Malta
-
 Mauritius
-
 Mexico
-
 Moldova
-
 Mongolia
-
 Montenegro
-
 Morocco
-
 Mozambique
-
 Myanmar
-
 Namibia
-
 Nepal
-
 Netherlands
-
 New Zealand
-
 Nigeria
-
 North Macedonia
-
 Norway
-
 Oman
-
 Pakistan
-
 Palestine
-
 Panama
-
 Papua New Guinea
-
 Paraguay
-
 Peru
-
 Philippines
-
 Poland
-
 Portugal
-
 Puerto Rico
-
 Qatar
-
 Reunion
-
 Romania
-
 Rwanda
-
 Saudi Arabia
-
 Serbia
-
 Singapore
-
 Slovakia
-
 Slovenia
-
 Somalia
-
 South Africa
-
 Spain
-
 Sri Lanka
-
 Sweden
-
 Switzerland
-
 Syria
-
 Taiwan
-
 Tajikistan
-
 Tanzania
-
 Thailand
-
 Trinidad and Tobago
-
 Tunisia
-
 Turkey
-
 UAE
-
 Uganda
-
 Ukraine
-
 United Kingdom
-
United States
-
 Uruguay
-
 Uzbekistan
-
 Venezuela
-
 Vietnam
-
 Yemen
-
 Zambia
-
 Zimbabwe
- Forex
- Crypto












