

Why is Amentum Holdings stock down 3.1% today?

Amentum Holdings LLC (AMTM) declined 3.19% as persistent selling pressure and bearish technical momentum weighed on the stock. The down move is supported by seller dominance across all major time frames, with AMTM trading below its 20-, 50-, and 200-day moving averages and key resistance levels still intact.
 22.16
23.37
Highlights
- Shares of Amentum Holdings trade below major moving averages, confirming dominant sellers across all time frames.
- All momentum indicators report strong oversold conditions and consistent negative intraday price action.
- Amentum Holdings stock is expected to remain in a $17.11 to $18.69 range over the next five days, with a high probability of continued downside.
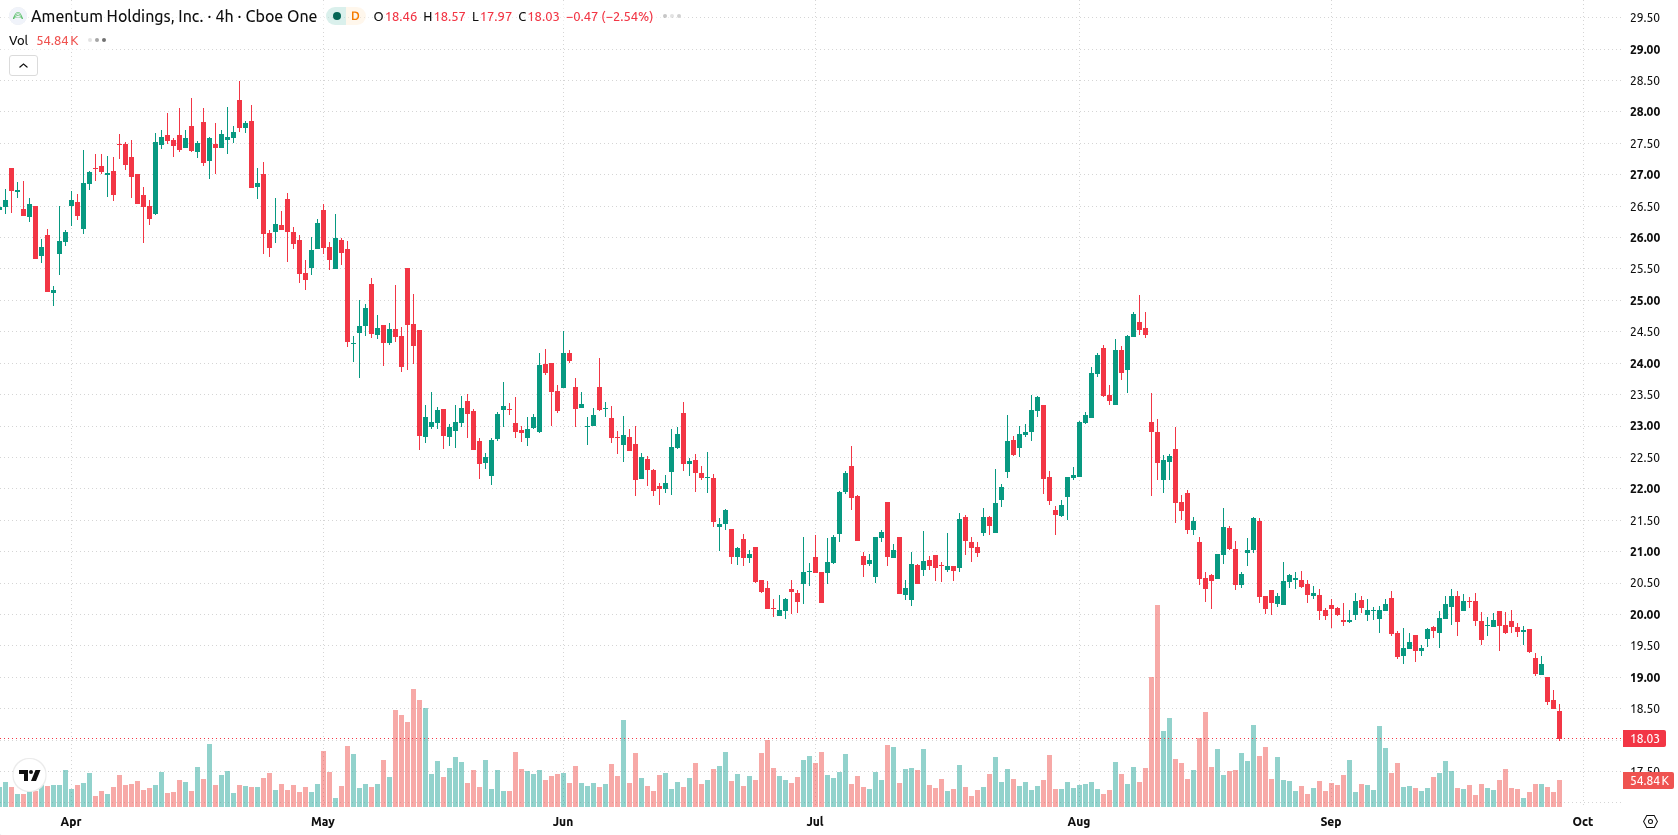
Downward momentum confirmed as oversold signals stack up
Amentum Holdings is trading below its 20-day ($19.73), 50-day ($21.06), and 200-day ($25.79) moving averages, which reflects seller dominance across short-, medium-, and long-term time frames. The near-term ceiling for the stock sits at $18.11, and the nearest floor is at $17.11, with the bearish alignment of the 50-day versus 200-day averages confirming a prevailing downward trend. Momentum indicators are broadly negative, with the MACD signaling sell and the ADX reading as neutral, indicating weak trend strength. The RSI at 33.13 is near oversold territory. Stochastic RSI, CCI, and BBP all report strong oversold signals, confirming sellers dominate intraday momentum. The stock is currently priced at $17.90, down $0.59 or 3.19% on the day after opening with a downside gap of $0.08 (0.43%), trading near the session low. Intraday volatility stands at 2.60%, supporting the negative momentum readings.
Earlier, analysts noted that Amentum Holdings was under persistent downside pressure, with technicals indicating an ongoing bearish trend. The latest decline and renewed negative momentum in the current article confirm that risks remain skewed to the downside, making the $17.11 support level critical for short-term direction.






Latest Amentum Holdings LLC News




-
 Afghanistan
-
 Albania
-
 Algeria
-
 Angola
-
 Argentina
-
 Armenia
-
 Australia
-
 Austria
-
 Azerbaijan
-
 Bahamas
-
 Bahrain
-
 Bangladesh
-
 Belarus
-
 Belgium
-
 Bolivia
-
 Botswana
-
 Brazil
-
 Brunei
-
 Bulgaria
-
 Cambodia
-
 Cameroon
-
 Canada
-
 Chile
-
 China
-
 Colombia
-
 Congo
-
 Costa Rica
-
 Cote d'Ivoire
-
 Croatia
-
 Cuba
-
 Cyprus
-
 Czechia
-
 DR Congo
-
 Denmark
-
 Dominican Republic
-
 Ecuador
-
 Egypt
-
 El Salvador
-
 Estonia
-
 Eswatini
-
 Ethiopia
-
 Finland
-
 France
-
 Georgia
-
 Germany
-
 Ghana
-
 Greece
-
 Haiti
-
 Hong Kong
-
 Hungary
-
 India
-
 Indonesia
-
 Iran, Islamic republic
-
 Iraq
-
 Ireland
-
 Israel
-
 Italy
-
 Jamaica
-
 Japan
-
 Jordan
-
 Kazakhstan
-
 Kenya
-
 Korea
-
 Kuwait
-
 Kyrgyzstan
-
 Laos
-
 Latvia
-
 Lebanon
-
 Lesotho
-
 Libya
-
 Lithuania
-
 Luxembourg
-
 Madagascar
-
 Malaysia
-
 Malta
-
 Mauritius
-
 Mexico
-
 Moldova
-
 Mongolia
-
 Montenegro
-
 Morocco
-
 Mozambique
-
 Myanmar
-
 Namibia
-
 Nepal
-
 Netherlands
-
 New Zealand
-
 Nigeria
-
 North Macedonia
-
 Norway
-
 Oman
-
 Pakistan
-
 Palestine
-
 Panama
-
 Papua New Guinea
-
 Paraguay
-
 Peru
-
 Philippines
-
 Poland
-
 Portugal
-
 Puerto Rico
-
 Qatar
-
 Reunion
-
 Romania
-
 Rwanda
-
 Saudi Arabia
-
 Serbia
-
 Singapore
-
 Slovakia
-
 Slovenia
-
 Somalia
-
 South Africa
-
 Spain
-
 Sri Lanka
-
 Sweden
-
 Switzerland
-
 Syria
-
 Taiwan
-
 Tajikistan
-
 Tanzania
-
 Thailand
-
 Trinidad and Tobago
-
 Tunisia
-
 Turkey
-
 UAE
-
 Uganda
-
 Ukraine
-
 United Kingdom
-
United States
-
 Uruguay
-
 Uzbekistan
-
 Venezuela
-
 Vietnam
-
 Yemen
-
 Zambia
-
 Zimbabwe
- Forex
- Crypto












