

GSK holds near daily low as support pressure weighs on recovery attempt

GSK (GSK) stock is trading at GBX1,866 after a modest uptick on the day. The price remains below its key moving averages, signaling that recent gains have not yet reversed the prevailing underlying trend.
 1860.00
1949.68
Highlights
- GSK stock currently offers a 3.6% dividend yield, providing income appeal for yield-focused investors.
- This dividend yield may support GSK stock valuation during periods of increased market volatility.
- Shares of GSK trade below key moving averages with dominant selling momentum, and are expected to range between GBX1,812 and GBX1,899 over the next four days.
Dividend yield offers portfolio appeal during heightened volatility
Finance Yahoo reports that GSK currently maintains a 3.6% dividend yield, a figure that provides shareholders with a tangible source of return and may appeal to yield-oriented investors. Such a yield can influence demand for the stock by positioning it as an income-generating holding within portfolios. While the yield is a standing aspect of the equity, its presence offers some valuation support in periods of heightened volatility.
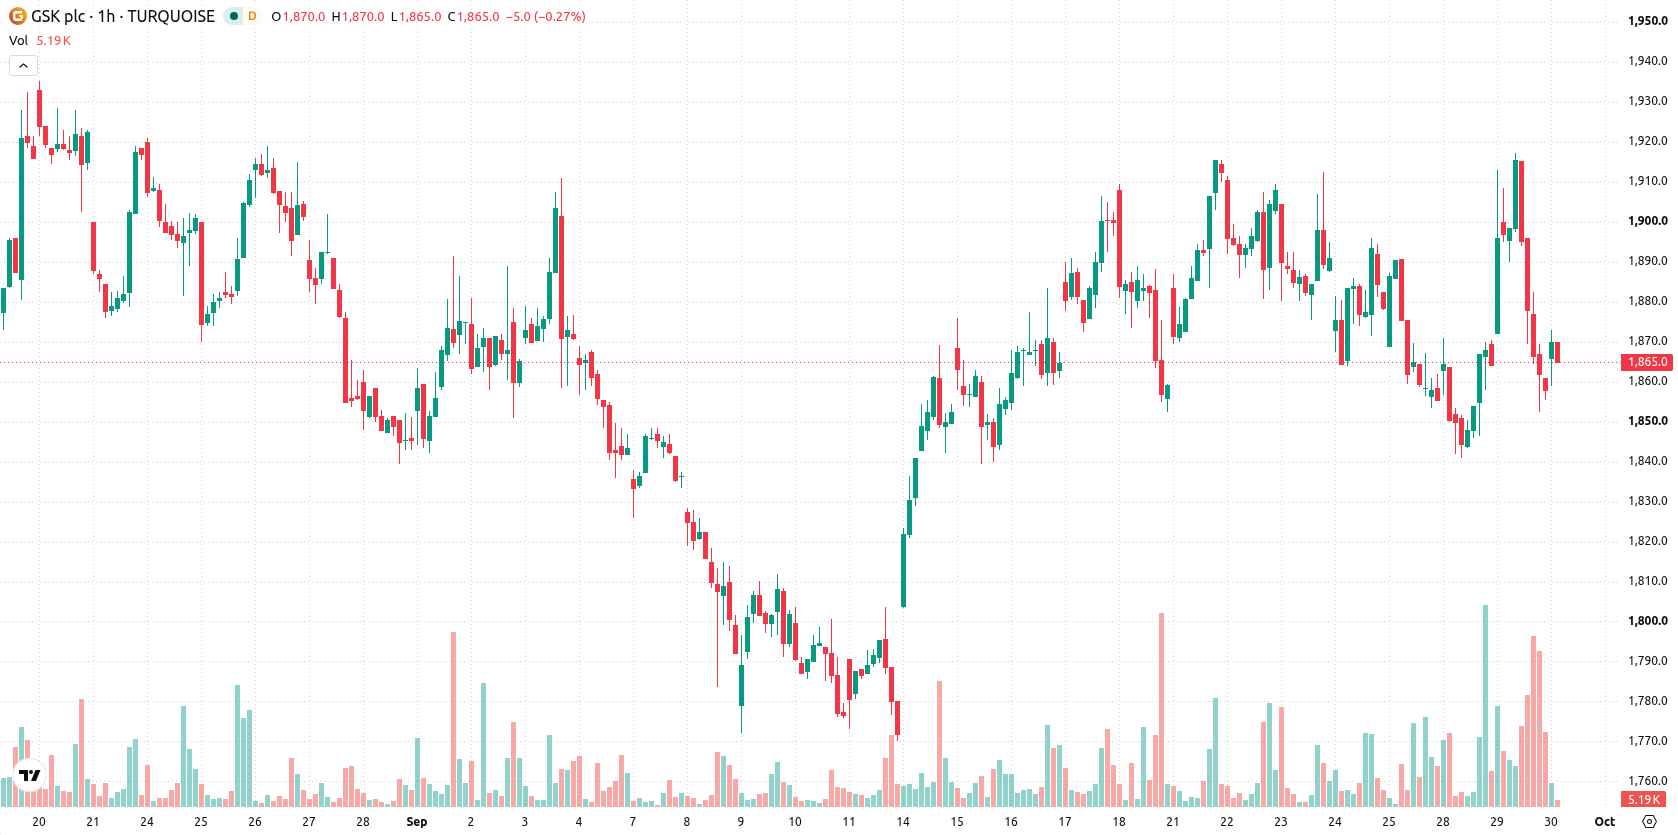
Mixed momentum signals as resistance holds and sellers remain active
On the H1 chart, the price of GSK sits below both the MA-20 at GBX1,870 and MA-50 at GBX1,877, while remaining under the long-term MA-200 at GBX1,953 (daily). The Ichimoku Kijun level emerges as immediate resistance at GBX1,879. Momentum indicators present a mixed picture: RSI is at 47.73 (Sell), with Stochastic RSI showing an oversold condition. Bull/Bear Power signals intraday strength for sellers, while MACD, ADX, and CCI are neutral, but the Awesome Oscillator continues to indicate a strong sell bias. The price is trading near the low of today’s range within a volatile session, highlighting market sensitivity to any upward movements.
Downside risk prevails as consolidation dominates trading outlook
In the short term, GSK is expected to fluctuate within the GBX1,812 to GBX1,899 volatility band relative to current levels over the next four trading days. There is a 44% probability of an upward move, while a downward scenario holds a higher likelihood at 56%. The baseline scenario projects ongoing consolidation within this corridor. A bullish advancement would require a clear break above the GBX1,879 resistance, whereas renewed selling could see price push below the GBX1,812 support level.
Earlier, analysts noted that strength in healthcare stocks like GSK contributed to gains in London equities amid headline sector news and market-moving events. With mixed momentum signals and volatility prevailing, traders should monitor the GBX1,879 resistance level as a pivot point for any meaningful directional breakout in the near term.










-
 Afghanistan
-
 Albania
-
 Algeria
-
 Angola
-
 Argentina
-
 Armenia
-
 Australia
-
 Austria
-
 Azerbaijan
-
 Bahamas
-
 Bahrain
-
 Bangladesh
-
 Belarus
-
 Belgium
-
 Bolivia
-
 Botswana
-
 Brazil
-
 Brunei
-
 Bulgaria
-
 Cambodia
-
 Cameroon
-
 Canada
-
 Chile
-
 China
-
 Colombia
-
 Congo
-
 Costa Rica
-
 Cote d'Ivoire
-
 Croatia
-
 Cuba
-
 Cyprus
-
 Czechia
-
 DR Congo
-
 Denmark
-
 Dominican Republic
-
 Ecuador
-
 Egypt
-
 El Salvador
-
 Estonia
-
 Eswatini
-
 Ethiopia
-
 Finland
-
 France
-
 Georgia
-
 Germany
-
 Ghana
-
 Greece
-
 Haiti
-
 Hong Kong
-
 Hungary
-
 India
-
 Indonesia
-
 Iran, Islamic republic
-
 Iraq
-
 Ireland
-
 Israel
-
 Italy
-
 Jamaica
-
 Japan
-
 Jordan
-
 Kazakhstan
-
 Kenya
-
 Korea
-
 Kuwait
-
 Kyrgyzstan
-
 Laos
-
 Latvia
-
 Lebanon
-
 Lesotho
-
 Libya
-
 Lithuania
-
 Luxembourg
-
 Madagascar
-
 Malaysia
-
 Malta
-
 Mauritius
-
 Mexico
-
 Moldova
-
 Mongolia
-
 Montenegro
-
 Morocco
-
 Mozambique
-
 Myanmar
-
 Namibia
-
 Nepal
-
 Netherlands
-
 New Zealand
-
 Nigeria
-
 North Macedonia
-
 Norway
-
 Oman
-
 Pakistan
-
 Palestine
-
 Panama
-
 Papua New Guinea
-
 Paraguay
-
 Peru
-
 Philippines
-
 Poland
-
 Portugal
-
 Puerto Rico
-
 Qatar
-
 Reunion
-
 Romania
-
 Rwanda
-
 Saudi Arabia
-
 Serbia
-
 Singapore
-
 Slovakia
-
 Slovenia
-
 Somalia
-
 South Africa
-
 Spain
-
 Sri Lanka
-
 Sweden
-
 Switzerland
-
 Syria
-
 Taiwan
-
 Tajikistan
-
 Tanzania
-
 Thailand
-
 Trinidad and Tobago
-
 Tunisia
-
 Turkey
-
 UAE
-
 Uganda
-
 Ukraine
-
 United Kingdom
-
United States
-
 Uruguay
-
 Uzbekistan
-
 Venezuela
-
 Vietnam
-
 Yemen
-
 Zambia
-
 Zimbabwe
- Forex
- Crypto












