

Costco stock direction hinges on upcoming drivers as support and resistance cap movement: weekly analysis

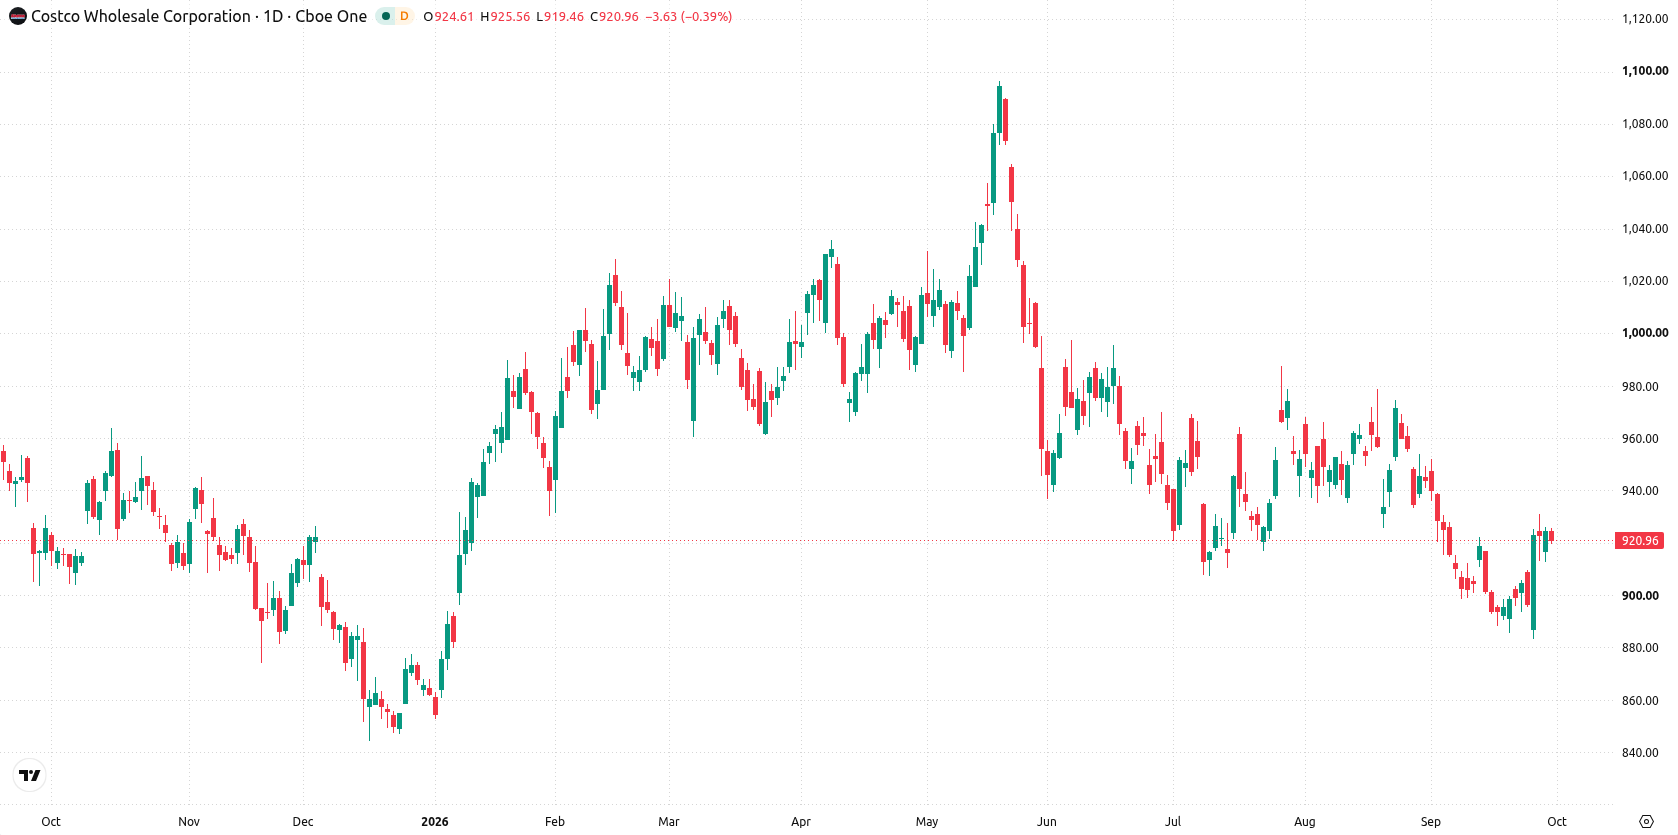
Shares of Costco Wholesale Corporation (COST) are trading near $921 as the chart shows the recovery holding, but with a stretched setup and mixed technical signals. The current rangebound momentum and conflicting indicators are keeping investors cautious, setting up a week where direction hinges on new drivers or a clear technical break.
 1021.31
Highlights
- Shares of Costco are trading at $920.6, holding above short-term support within a narrow weekly range.
- Technical structure is bearish long term as the stock trades below key moving averages with mixed daily momentum.
- Expected trading range in the week ahead is $894.4 to $936.46, with consolidation between $910 and $929.9 as the base case.
Earnings-driven optimism builds as special dividend and insider sale shape focus
Costco reported strong results for fiscal Q4 2026, with revenue rising 11.1% year over year to $95.72 billion and non-GAAP profit of $6.60 per share topping Wall Street expectations by 1.2%, according to Yahoo Finance and Alphastreet. The performance was driven by growth across both traditional and digital channels, robust executive membership gains, and reinvestments of tariff refunds into lower prices. Anticipation of a possible special dividend and disclosure of an officer's proposed sale of 801 shares in recent SEC filings provided additional focus for the market heading into the week.
Sell momentum intensifies as oscillators diverge within consolidating range
On the daily chart, structure is neutral, with recent movement contained within a narrow range and volatility measured at 3.96%. The MACD maintains a strong sell reading at -5.75, and HMA also signals strong sell momentum, while the Stochastic RSI is in the overbought zone at 100, reflecting mixed short-term signals. Nearest support sits at $910, while resistance is identified at $929.9, marked by the Ichimoku Kijun line. This suggests the stock is consolidating between these levels, with no clear directional trend as daily momentum remains conflicted.
Neutral bias likely next week unless key support or resistance breaks
In the week ahead, the expected range is $894.4 to $936.46, with a 43% probability of an increase and 57% probability of a decrease. The base case is continued consolidation between $910 and $929.9, as signals remain mixed and trend strength stays flat. A bullish break above $929.9 would open the door to further upside toward the $936.46 upper boundary. If support at $910 fails, the stock could trade down toward $894.4.
Earlier, analysts noted that Costco’s performance reflected resilient member spending and ongoing value-driven strategies amid a cautious consumer environment. With current trading momentum remaining rangebound and technical signals mixed, traders should monitor whether price action can break decisively above $929.9 resistance or below $910 support for a directional move.











-
 Afghanistan
-
 Albania
-
 Algeria
-
 Angola
-
 Argentina
-
 Armenia
-
 Australia
-
 Austria
-
 Azerbaijan
-
 Bahamas
-
 Bahrain
-
 Bangladesh
-
 Belarus
-
 Belgium
-
 Bolivia
-
 Botswana
-
 Brazil
-
 Brunei
-
 Bulgaria
-
 Cambodia
-
 Cameroon
-
 Canada
-
 Chile
-
 China
-
 Colombia
-
 Congo
-
 Costa Rica
-
 Cote d'Ivoire
-
 Croatia
-
 Cuba
-
 Cyprus
-
 Czechia
-
 DR Congo
-
 Denmark
-
 Dominican Republic
-
 Ecuador
-
 Egypt
-
 El Salvador
-
 Estonia
-
 Eswatini
-
 Ethiopia
-
 Finland
-
 France
-
 Georgia
-
 Germany
-
 Ghana
-
 Greece
-
 Haiti
-
 Hong Kong
-
 Hungary
-
 India
-
 Indonesia
-
 Iran, Islamic republic
-
 Iraq
-
 Ireland
-
 Israel
-
 Italy
-
 Jamaica
-
 Japan
-
 Jordan
-
 Kazakhstan
-
 Kenya
-
 Korea
-
 Kuwait
-
 Kyrgyzstan
-
 Laos
-
 Latvia
-
 Lebanon
-
 Lesotho
-
 Libya
-
 Lithuania
-
 Luxembourg
-
 Madagascar
-
 Malaysia
-
 Malta
-
 Mauritius
-
 Mexico
-
 Moldova
-
 Mongolia
-
 Montenegro
-
 Morocco
-
 Mozambique
-
 Myanmar
-
 Namibia
-
 Nepal
-
 Netherlands
-
 New Zealand
-
 Nigeria
-
 North Macedonia
-
 Norway
-
 Oman
-
 Pakistan
-
 Palestine
-
 Panama
-
 Papua New Guinea
-
 Paraguay
-
 Peru
-
 Philippines
-
 Poland
-
 Portugal
-
 Puerto Rico
-
 Qatar
-
 Reunion
-
 Romania
-
 Rwanda
-
 Saudi Arabia
-
 Serbia
-
 Singapore
-
 Slovakia
-
 Slovenia
-
 Somalia
-
 South Africa
-
 Spain
-
 Sri Lanka
-
 Sweden
-
 Switzerland
-
 Syria
-
 Taiwan
-
 Tajikistan
-
 Tanzania
-
 Thailand
-
 Trinidad and Tobago
-
 Tunisia
-
 Turkey
-
 UAE
-
 Uganda
-
 Ukraine
-
 United Kingdom
-
United States
-
 Uruguay
-
 Uzbekistan
-
 Venezuela
-
 Vietnam
-
 Yemen
-
 Zambia
-
 Zimbabwe
- Forex
- Crypto












