

Amazon stock decline stretches into oversold territory: weekly analysis

Shares of Amazon.com, Inc. (AMZN) are trading near $251 as the recent decline has brought the stock into oversold territory on daily momentum signals. Technical charts reveal a stalling pattern, with mixed momentum suggesting that sellers may be losing conviction despite the week’s contained price action. As the new week begins, traders are closely watching for a decisive break from this range to resolve the cautious setup.
 241.48
255.18
Highlights
- Shares of Amazon closed at $250.56 after edging higher by $0.88 over the past 7 days, trading just below short-term moving averages.
- Technical indicators show a neutral to mildly cautious structure, with mixed momentum signals and signs of downside exhaustion emerging.
- Shares are expected to consolidate between $238.82 and $253.29, anchored by support at $244.73 and resistance at $250.84.
Capex scrutiny intensifies as AI bets and AWS growth guide sentiment
Amazon's capital investment in artificial intelligence and cloud infrastructure is under scrutiny ahead of the company's upcoming third-quarter earnings release, according to multiple financial outlets. Amazon will report results on October 29, 2026, with analysts on Yahoo Finance highlighting projected revenue of $202.01 billion and $2.01 in earnings per share. The company’s $220 billion capex outlook for 2026 and rapid AWS growth, as reported by 24/7 Wall St. and Yahoo Finance, remain key to sentiment, supported by The Motley Fool's reminder of Amazon's long-term outperformance and reinvestment strategy.
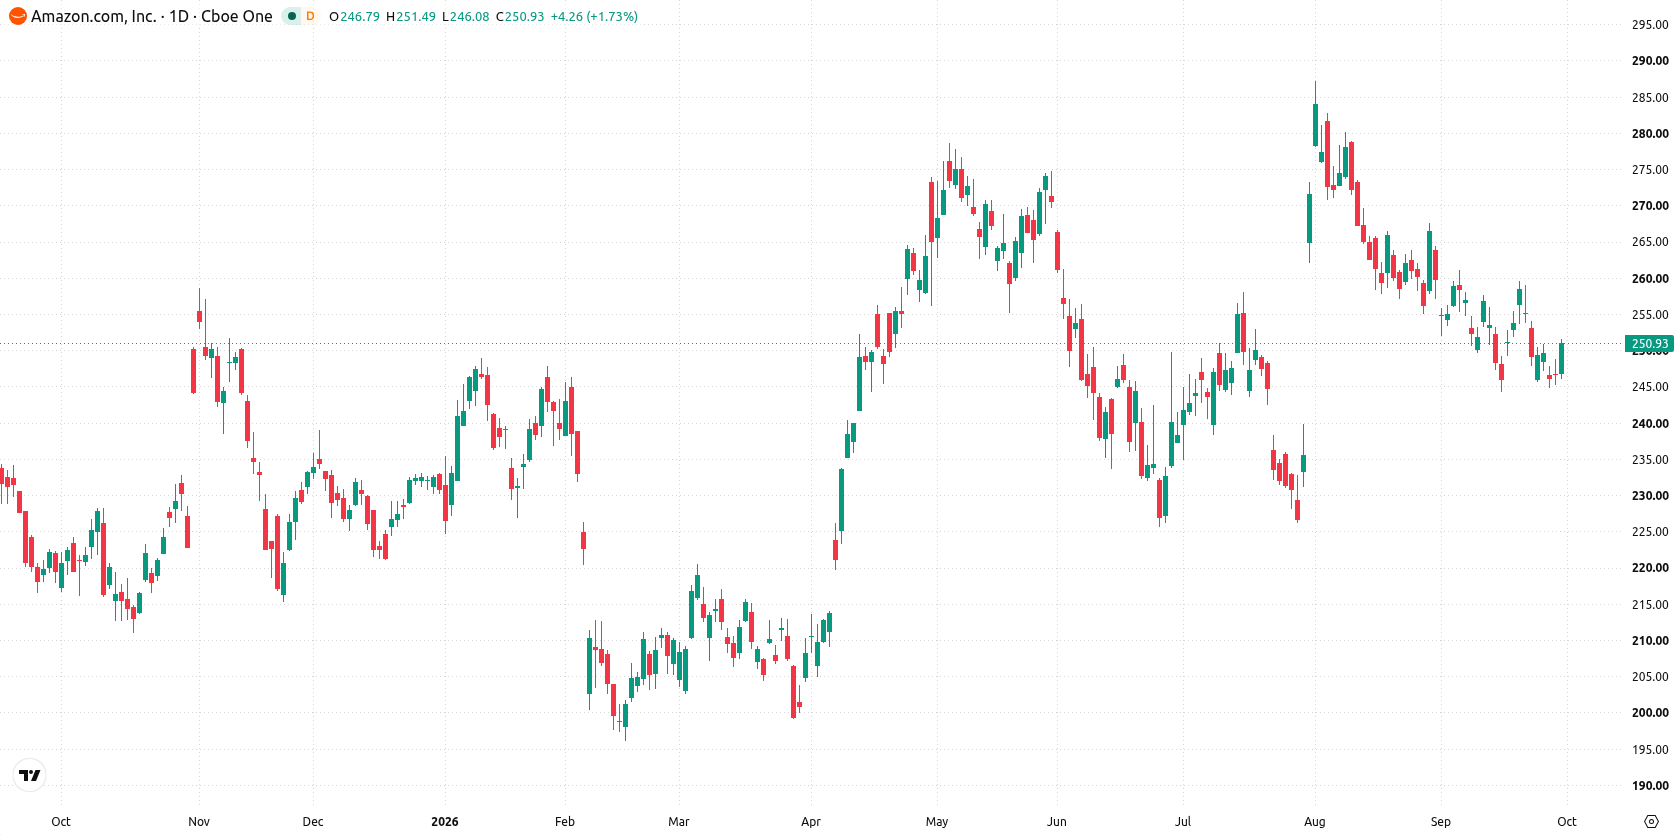
Narrow weekly range persists as mixed indicators hint at cautious bias
On the daily chart, the structure is characterized by a contained move within a narrow range, with volatility over the past week registering at 2.5%. Momentum signals are mixed: the RSI sits in the neutral zone at 41.88, while Stochastic RSI and CCI both read oversold, signaling emerging downside exhaustion. Immediate support stands at $244.73, while shares are pinned to resistance at $250.84 and also face the Ichimoku Kijun near $255.83 overhead. Prices are clustered near the top of the weekly range, suggesting the short-term bias remains cautious unless a clear breakout occurs.
Consolidation likely next week as resistance and support narrow forecast range
Over the coming trading week, Amazon shares are forecast to trade between $238.82 and $253.29, with a 35% probability of an increase and a 65% probability of a decrease. The base case calls for consolidation within this range, anchored by resistance at $250.84 and support at $244.73. A move above resistance could open the way for a test towards $253.29. Should the stock slip below support at $244.73, the lower end of the range near $238.82 comes into view.
Earlier, analysts noted that Amazon's strategic investments in artificial intelligence and cloud infrastructure positioned the company favorably within a broad wave of positive brokerage commentary on technology leaders. Building on this, traders should monitor for any decisive price action above resistance, as a sustained breakout would signal a shift from the current consolidation phase and may recalibrate the near-term risk-reward profile.











-
 Afghanistan
-
 Albania
-
 Algeria
-
 Angola
-
 Argentina
-
 Armenia
-
 Australia
-
 Austria
-
 Azerbaijan
-
 Bahamas
-
 Bahrain
-
 Bangladesh
-
 Belarus
-
 Belgium
-
 Bolivia
-
 Botswana
-
 Brazil
-
 Brunei
-
 Bulgaria
-
 Cambodia
-
 Cameroon
-
 Canada
-
 Chile
-
 China
-
 Colombia
-
 Congo
-
 Costa Rica
-
 Cote d'Ivoire
-
 Croatia
-
 Cuba
-
 Cyprus
-
 Czechia
-
 DR Congo
-
 Denmark
-
 Dominican Republic
-
 Ecuador
-
 Egypt
-
 El Salvador
-
 Estonia
-
 Eswatini
-
 Ethiopia
-
 Finland
-
 France
-
 Georgia
-
 Germany
-
 Ghana
-
 Greece
-
 Haiti
-
 Hong Kong
-
 Hungary
-
 India
-
 Indonesia
-
 Iran, Islamic republic
-
 Iraq
-
 Ireland
-
 Israel
-
 Italy
-
 Jamaica
-
 Japan
-
 Jordan
-
 Kazakhstan
-
 Kenya
-
 Korea
-
 Kuwait
-
 Kyrgyzstan
-
 Laos
-
 Latvia
-
 Lebanon
-
 Lesotho
-
 Libya
-
 Lithuania
-
 Luxembourg
-
 Madagascar
-
 Malaysia
-
 Malta
-
 Mauritius
-
 Mexico
-
 Moldova
-
 Mongolia
-
 Montenegro
-
 Morocco
-
 Mozambique
-
 Myanmar
-
 Namibia
-
 Nepal
-
 Netherlands
-
 New Zealand
-
 Nigeria
-
 North Macedonia
-
 Norway
-
 Oman
-
 Pakistan
-
 Palestine
-
 Panama
-
 Papua New Guinea
-
 Paraguay
-
 Peru
-
 Philippines
-
 Poland
-
 Portugal
-
 Puerto Rico
-
 Qatar
-
 Reunion
-
 Romania
-
 Rwanda
-
 Saudi Arabia
-
 Serbia
-
 Singapore
-
 Slovakia
-
 Slovenia
-
 Somalia
-
 South Africa
-
 Spain
-
 Sri Lanka
-
 Sweden
-
 Switzerland
-
 Syria
-
 Taiwan
-
 Tajikistan
-
 Tanzania
-
 Thailand
-
 Trinidad and Tobago
-
 Tunisia
-
 Turkey
-
 UAE
-
 Uganda
-
 Ukraine
-
 United Kingdom
-
United States
-
 Uruguay
-
 Uzbekistan
-
 Venezuela
-
 Vietnam
-
 Yemen
-
 Zambia
-
 Zimbabwe
- Forex
- Crypto












