

What's behind Patterson-UTI Energy's latest 4.0% stock surge?

Patterson-UTI Energy Inc (PTEN) advanced 4.04% in a session marked by technical buying pressure as the stock rebounded from oversold conditions and approached the day's highs. The move remains constrained, with the price still trading below both the 20-day and 50-day moving averages, indicating ongoing medium-term resistance to further upside.
 11.50
13.32
Highlights
- Shares of Patterson-UTI Energy last traded at $10.98, closing up 4.04% after an intraday upside gap and volatility of 4.28%.
- The stock is trading below short- and medium-term moving averages but remains above its longer-term 200-day average, indicating sustained short-term selling pressure amid longer-term support.
- Momentum indicators are negative and trend signals remain weak, with a 70% probability of the price moving down to $10.54 to $11.42 over the next five sessions.
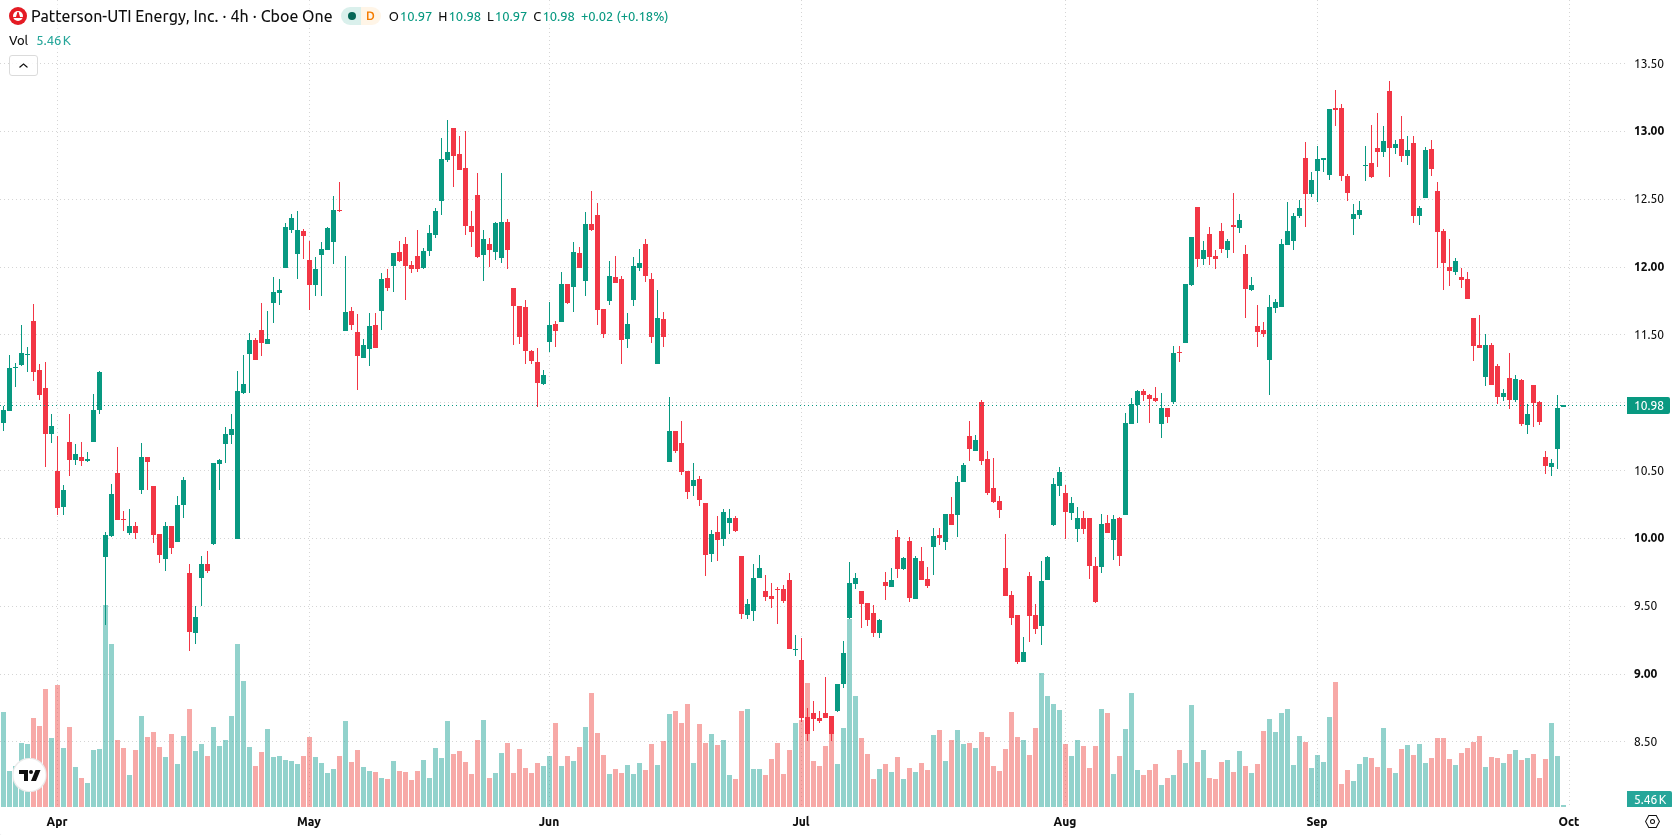
Persistent selling momentum as medium-term resistance outweighs oversold signals
Patterson-UTI Energy is trading below its 20-day and 50-day moving averages at $12.02 and $11.38, respectively, but above its 200-day moving average at $9.95. This setup signals sustained pressure from sellers over the short and medium term, though long-term trend support remains intact. The immediate ceiling is at $11.35 with a near-term floor at $10.96. Momentum indicators are broadly negative: the MACD is bearish, and the ADX shows a weak trend. The RSI is at 33.48, giving a 'Sell' signal, while both the Stochastic RSI and CCI are in oversold territory, suggesting growing exhaustion among sellers. Bull/Bear Power reads -0.73, confirming intraday selling control with an oversold forecast. The Awesome Oscillator reinforces this selling bias. The last trade was at $10.98, up $0.43 for the day, with the price quoted near session highs and intraday volatility at 4.28%. Robust upward strength is noted during the session, yet selling momentum from oscillators persists.
Previously it was reported that Patterson-UTI Energy remained under persistent selling pressure due to negative momentum and ongoing fundamental headwinds. The current technical rebound is constrained by medium-term resistance, making the $10.54 support level a critical downside risk to monitor in the near term.










-
 Afghanistan
-
 Albania
-
 Algeria
-
 Angola
-
 Argentina
-
 Armenia
-
 Australia
-
 Austria
-
 Azerbaijan
-
 Bahamas
-
 Bahrain
-
 Bangladesh
-
 Belarus
-
 Belgium
-
 Bolivia
-
 Botswana
-
 Brazil
-
 Brunei
-
 Bulgaria
-
 Cambodia
-
 Cameroon
-
 Canada
-
 Chile
-
 China
-
 Colombia
-
 Congo
-
 Costa Rica
-
 Cote d'Ivoire
-
 Croatia
-
 Cuba
-
 Cyprus
-
 Czechia
-
 DR Congo
-
 Denmark
-
 Dominican Republic
-
 Ecuador
-
 Egypt
-
 El Salvador
-
 Estonia
-
 Eswatini
-
 Ethiopia
-
 Finland
-
 France
-
 Georgia
-
 Germany
-
 Ghana
-
 Greece
-
 Haiti
-
 Hong Kong
-
 Hungary
-
 India
-
 Indonesia
-
 Iran, Islamic republic
-
 Iraq
-
 Ireland
-
 Israel
-
 Italy
-
 Jamaica
-
 Japan
-
 Jordan
-
 Kazakhstan
-
 Kenya
-
 Korea
-
 Kuwait
-
 Kyrgyzstan
-
 Laos
-
 Latvia
-
 Lebanon
-
 Lesotho
-
 Libya
-
 Lithuania
-
 Luxembourg
-
 Madagascar
-
 Malaysia
-
 Malta
-
 Mauritius
-
 Mexico
-
 Moldova
-
 Mongolia
-
 Montenegro
-
 Morocco
-
 Mozambique
-
 Myanmar
-
 Namibia
-
 Nepal
-
 Netherlands
-
 New Zealand
-
 Nigeria
-
 North Macedonia
-
 Norway
-
 Oman
-
 Pakistan
-
 Palestine
-
 Panama
-
 Papua New Guinea
-
 Paraguay
-
 Peru
-
 Philippines
-
 Poland
-
 Portugal
-
 Puerto Rico
-
 Qatar
-
 Reunion
-
 Romania
-
 Rwanda
-
 Saudi Arabia
-
 Serbia
-
 Singapore
-
 Slovakia
-
 Slovenia
-
 Somalia
-
 South Africa
-
 Spain
-
 Sri Lanka
-
 Sweden
-
 Switzerland
-
 Syria
-
 Taiwan
-
 Tajikistan
-
 Tanzania
-
 Thailand
-
 Trinidad and Tobago
-
 Tunisia
-
 Turkey
-
 UAE
-
 Uganda
-
 Ukraine
-
 United Kingdom
-
United States
-
 Uruguay
-
 Uzbekistan
-
 Venezuela
-
 Vietnam
-
 Yemen
-
 Zambia
-
 Zimbabwe
- Forex
- Crypto












