

What's behind Patterson-UTI Energy's latest 3.2% stock pullback?

Patterson-UTI Energy Inc (PTEN) slid 3.17% as persistent selling emerged after the company reported negative free cash flow for the quarter and ongoing capital investments were highlighted. The weakness is underscored by the stock trading below its short- and medium-term moving averages, showing the downtrend is supported by negative momentum and oversold technical readings.
 13.00
13.32
Highlights
- Patterson-UTI Energy reported negative free cash flow and a $12.22 million net debt increase as it pursued capital investments.
- The company operates 135 super-spec drilling rigs, offers a 3.67% dividend yield, and plans to grow its rig count to 100 by Q3 2026.
- Shares of Patterson-UTI Energy trade below short- and medium-term averages with bearish momentum signals and an expected range of $10.22 to $10.92 over the next five trading days.
Broader selling pressure persists despite plans for rig count growth
Patterson-UTI Energy was reported to have negative free cash flow for the quarter, with a net debt increase of $12.22 million as the company continued capital investments. The company operates 135 Tier-1 super-spec drilling rigs and provides contract drilling, hydraulic fracturing, and drill bits to oil and gas operators. Recent reports noted that Patterson-UTI offers a dividend yield of 3.67% and is planning to grow its rig count from 96 in Q2 2026 to 100 in Q3 2026, along with anticipated continued growth in its Drilling and Completion segments, though price action has remained under broader selling pressure.
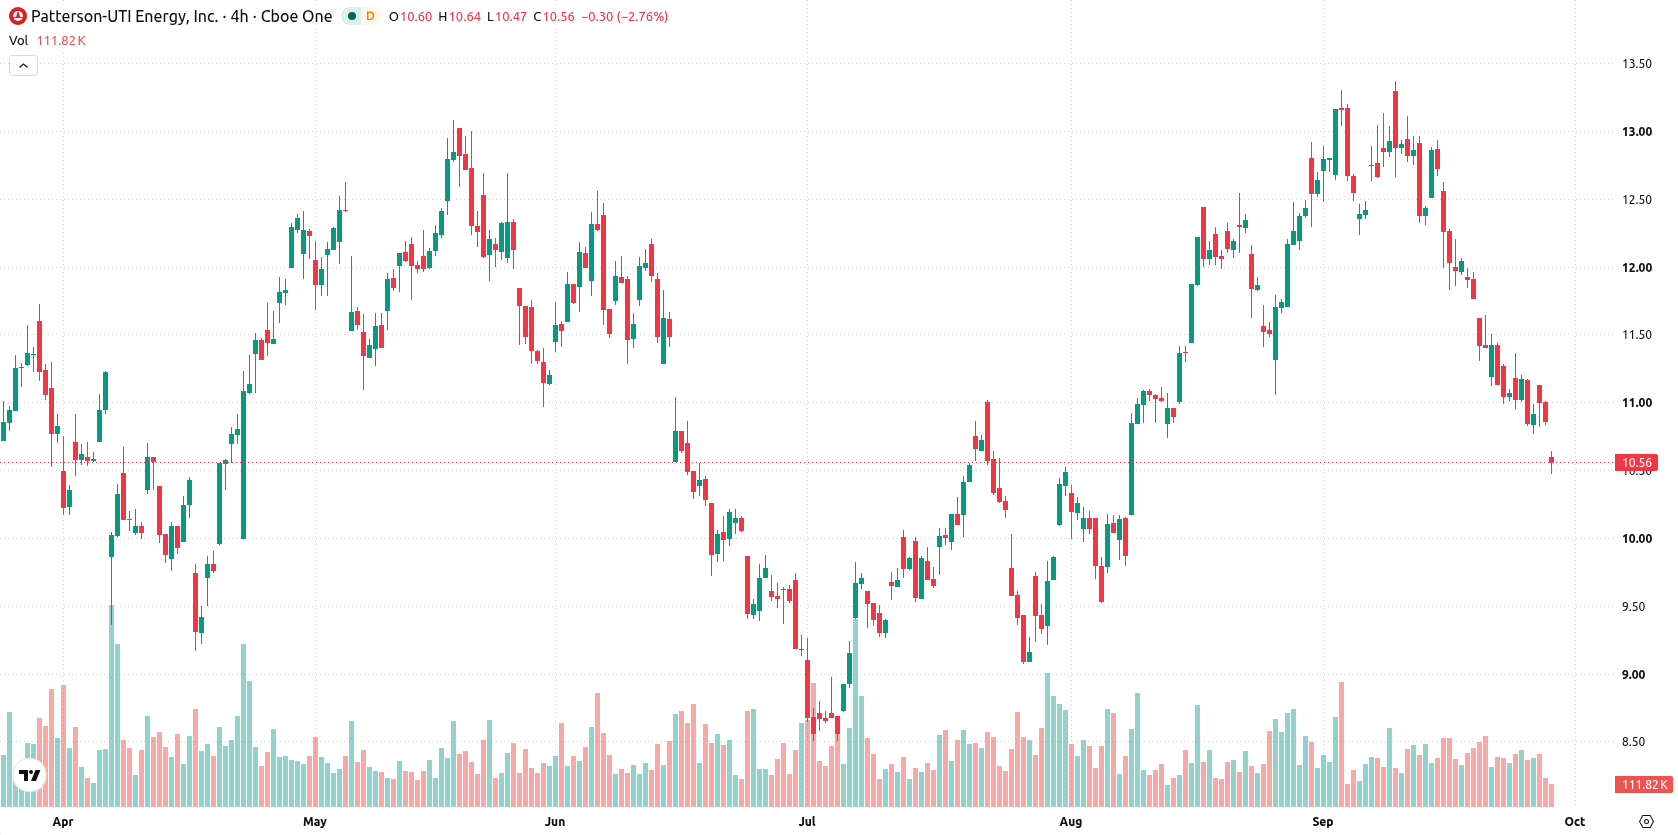
Persistent downtrend confirmed as negative momentum aligns with oversold signals
Patterson-UTI Energy is trading below both its 20-day and 50-day moving averages at $12.12 and $11.37, respectively, but remains above the 200-day moving average at $9.93. This points to short- and medium-term downtrend pressure within a longer-term bullish structure, with resistance near $10.78 and support at $10.22. Momentum is broadly negative: the MACD and RSI both issue sell signals, with the RSI at 36.66 signaling weak momentum. Both the Stochastic RSI and Commodity Channel Index show oversold conditions, Bull/Bear Power is negative at -0.43 confirming seller dominance, and the Awesome Oscillator also signals to sell. The stock is down to $10.51, near today's low, with daily volatility at 2.68% and selling pressure prevailing after the open.
Previously it was reported that Patterson-UTI Energy was facing persistent short- and medium-term selling pressures amid a bearish technical backdrop. The current analysis enhances this view by highlighting that ongoing negative free cash flow and rising net debt add fundamental headwinds, making a decisive move below the $10.22 support a key downside risk to monitor in the near term.










-
 Afghanistan
-
 Albania
-
 Algeria
-
 Angola
-
 Argentina
-
 Armenia
-
 Australia
-
 Austria
-
 Azerbaijan
-
 Bahamas
-
 Bahrain
-
 Bangladesh
-
 Belarus
-
 Belgium
-
 Bolivia
-
 Botswana
-
 Brazil
-
 Brunei
-
 Bulgaria
-
 Cambodia
-
 Cameroon
-
 Canada
-
 Chile
-
 China
-
 Colombia
-
 Congo
-
 Costa Rica
-
 Cote d'Ivoire
-
 Croatia
-
 Cuba
-
 Cyprus
-
 Czechia
-
 DR Congo
-
 Denmark
-
 Dominican Republic
-
 Ecuador
-
 Egypt
-
 El Salvador
-
 Estonia
-
 Eswatini
-
 Ethiopia
-
 Finland
-
 France
-
 Georgia
-
 Germany
-
 Ghana
-
 Greece
-
 Haiti
-
 Hong Kong
-
 Hungary
-
 India
-
 Indonesia
-
 Iran, Islamic republic
-
 Iraq
-
 Ireland
-
 Israel
-
 Italy
-
 Jamaica
-
 Japan
-
 Jordan
-
 Kazakhstan
-
 Kenya
-
 Korea
-
 Kuwait
-
 Kyrgyzstan
-
 Laos
-
 Latvia
-
 Lebanon
-
 Lesotho
-
 Libya
-
 Lithuania
-
 Luxembourg
-
 Madagascar
-
 Malaysia
-
 Malta
-
 Mauritius
-
 Mexico
-
 Moldova
-
 Mongolia
-
 Montenegro
-
 Morocco
-
 Mozambique
-
 Myanmar
-
 Namibia
-
 Nepal
-
 Netherlands
-
 New Zealand
-
 Nigeria
-
 North Macedonia
-
 Norway
-
 Oman
-
 Pakistan
-
 Palestine
-
 Panama
-
 Papua New Guinea
-
 Paraguay
-
 Peru
-
 Philippines
-
 Poland
-
 Portugal
-
 Puerto Rico
-
 Qatar
-
 Reunion
-
 Romania
-
 Rwanda
-
 Saudi Arabia
-
 Serbia
-
 Singapore
-
 Slovakia
-
 Slovenia
-
 Somalia
-
 South Africa
-
 Spain
-
 Sri Lanka
-
 Sweden
-
 Switzerland
-
 Syria
-
 Taiwan
-
 Tajikistan
-
 Tanzania
-
 Thailand
-
 Trinidad and Tobago
-
 Tunisia
-
 Turkey
-
 UAE
-
 Uganda
-
 Ukraine
-
 United Kingdom
-
United States
-
 Uruguay
-
 Uzbekistan
-
 Venezuela
-
 Vietnam
-
 Yemen
-
 Zambia
-
 Zimbabwe
- Forex
- Crypto












