

Can director-level hardware job cuts pressure Apple stock?

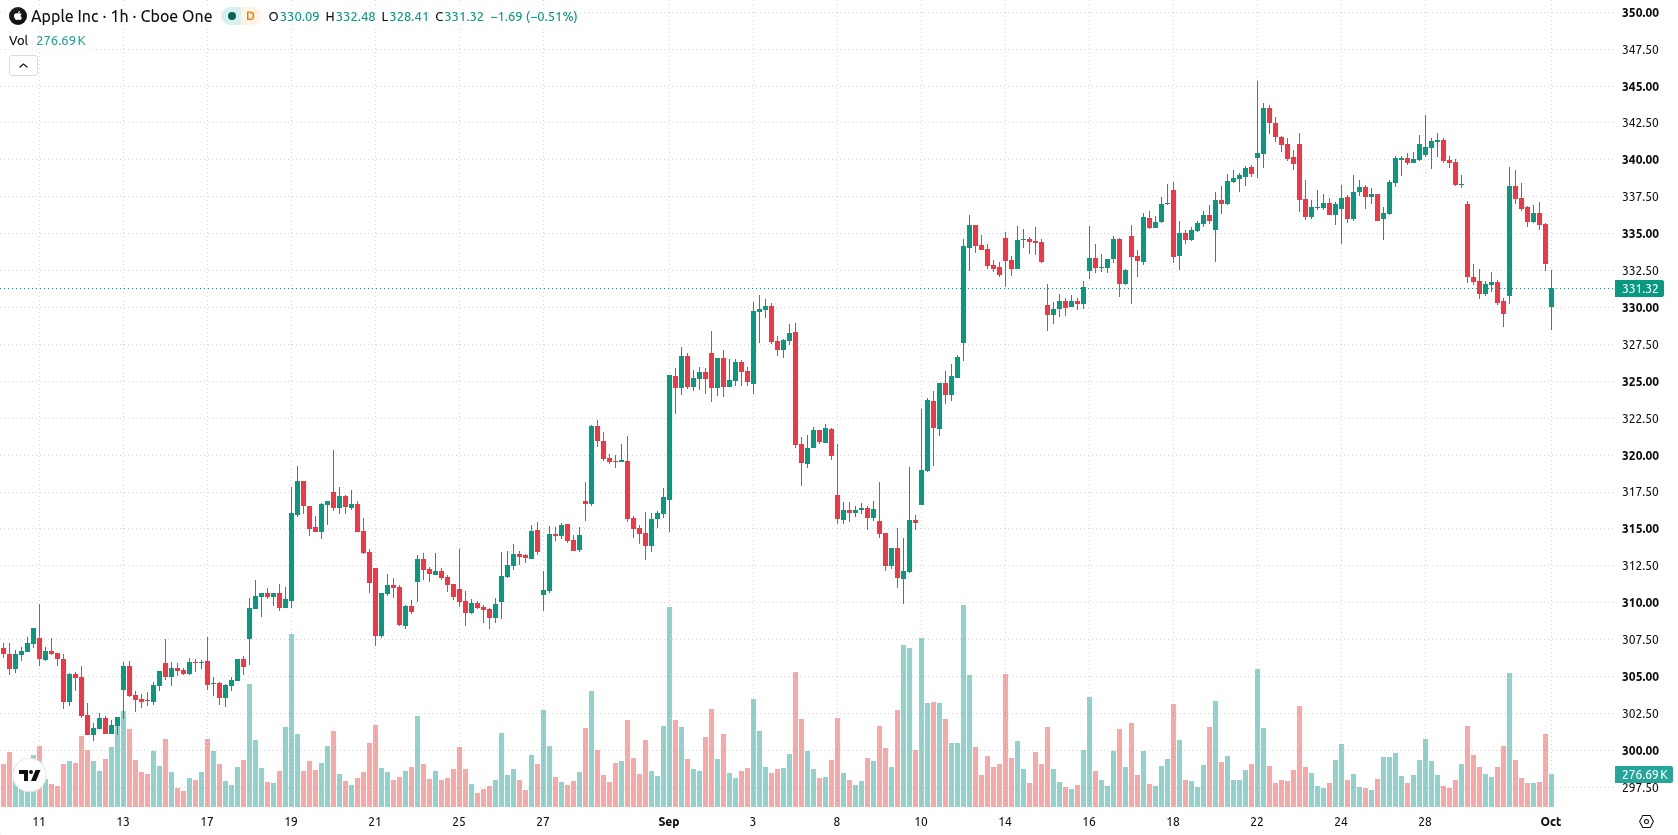
Apple Inc. (AAPL) stock is trading at $330.53 after a modest decline, closing near the day's low. The move leaves the price below its key short- and medium-term moving averages while still above longer-term trend levels.
 349.19
350.58
Highlights
- Apple has started layoffs and a major reorganization under new CEO John Ternus due to higher memory chip costs and declining services revenue.
- Director-level hardware engineering roles are being eliminated and lower-margin projects cancelled as Apple reprioritizes for profitability and operational efficiency.
- Apple stock trades below key short-term averages with technical signals skewed negative, and is forecast to move within $324.14 to $336.92, with sustained downside risk and rebound probability rated very low.
Restructuring and layoffs as cost pressures spur profit focus
Apple's new CEO, John Ternus, has begun implementing layoffs and a broad organizational restructuring in response to higher memory chip expenses and reduced services revenue, according to Finance Biggo. As part of these measures, director-level positions in hardware engineering are being cut, and select lower-margin projects have been cancelled to prioritize profitability. The company is also revising its product launch schedule, reflecting a sharper focus on cost management and operational efficiency in its strategic planning.
Selling momentum prevails as multiple indicators reinforce downside
On the hourly chart, AAPL is trading below the MA-20 at $335.09 and the MA-50 at $337.08, while the daily setup shows support above the MA-200 at $288.6. The Ichimoku Kijun line currently marks resistance at $335.85. Momentum indicators reinforce negative sentiment: MACD is set to Strong Sell and Awesome Oscillator is also on Sell. RSI stands at 41.87 in Sell territory, while ADX is Neutral, reflecting mixed trend strength. Bull/Bear Power sits in oversold territory, suggestive of ongoing seller dominance. Stoch RSI and CCI are both Neutral, highlighting the absence of strong extremes or reversals.
Downside risk persists as key supports face renewed test
For the coming several sessions, AAPL is expected to move within the typical volatility band between $324.14 and $336.92. Probabilities favor continued downside, with a high likelihood that the price may retest lower support levels and a very low probability of a breakout rebound. Consolidation between support and resistance levels is the baseline scenario; a bullish case requires a sustained move above $335.85, while a bearish scenario is possible if the lower boundary near $324.14 fails to hold.
Earlier, analysts noted that Apple's share price faced ongoing margin pressures and heightened sensitivity to growth concerns, while the company accelerated its push into new product categories and AI integration. The latest developments underscore a more defensive strategy focused on cost control and organizational restructuring, and traders should closely monitor the $324 level as a risk indicator for potential downside if support fails.











-
 Afghanistan
-
 Albania
-
 Algeria
-
 Angola
-
 Argentina
-
 Armenia
-
 Australia
-
 Austria
-
 Azerbaijan
-
 Bahamas
-
 Bahrain
-
 Bangladesh
-
 Belarus
-
 Belgium
-
 Bolivia
-
 Botswana
-
 Brazil
-
 Brunei
-
 Bulgaria
-
 Cambodia
-
 Cameroon
-
 Canada
-
 Chile
-
 China
-
 Colombia
-
 Congo
-
 Costa Rica
-
 Cote d'Ivoire
-
 Croatia
-
 Cuba
-
 Cyprus
-
 Czechia
-
 DR Congo
-
 Denmark
-
 Dominican Republic
-
 Ecuador
-
 Egypt
-
 El Salvador
-
 Estonia
-
 Eswatini
-
 Ethiopia
-
 Finland
-
 France
-
 Georgia
-
 Germany
-
 Ghana
-
 Greece
-
 Haiti
-
 Hong Kong
-
 Hungary
-
 India
-
 Indonesia
-
 Iran, Islamic republic
-
 Iraq
-
 Ireland
-
 Israel
-
 Italy
-
 Jamaica
-
 Japan
-
 Jordan
-
 Kazakhstan
-
 Kenya
-
 Korea
-
 Kuwait
-
 Kyrgyzstan
-
 Laos
-
 Latvia
-
 Lebanon
-
 Lesotho
-
 Libya
-
 Lithuania
-
 Luxembourg
-
 Madagascar
-
 Malaysia
-
 Malta
-
 Mauritius
-
 Mexico
-
 Moldova
-
 Mongolia
-
 Montenegro
-
 Morocco
-
 Mozambique
-
 Myanmar
-
 Namibia
-
 Nepal
-
 Netherlands
-
 New Zealand
-
 Nigeria
-
 North Macedonia
-
 Norway
-
 Oman
-
 Pakistan
-
 Palestine
-
 Panama
-
 Papua New Guinea
-
 Paraguay
-
 Peru
-
 Philippines
-
 Poland
-
 Portugal
-
 Puerto Rico
-
 Qatar
-
 Reunion
-
 Romania
-
 Rwanda
-
 Saudi Arabia
-
 Serbia
-
 Singapore
-
 Slovakia
-
 Slovenia
-
 Somalia
-
 South Africa
-
 Spain
-
 Sri Lanka
-
 Sweden
-
 Switzerland
-
 Syria
-
 Taiwan
-
 Tajikistan
-
 Tanzania
-
 Thailand
-
 Trinidad and Tobago
-
 Tunisia
-
 Turkey
-
 UAE
-
 Uganda
-
 Ukraine
-
 United Kingdom
-
United States
-
 Uruguay
-
 Uzbekistan
-
 Venezuela
-
 Vietnam
-
 Yemen
-
 Zambia
-
 Zimbabwe
- Forex
- Crypto












