

Cisco shares remain capped by $108.63 resistance with upside limited: weekly analysis

Shares of Cisco Systems, Inc. (CSCO) are trading near $108 after rising around 1.3% this week, as buyers struggle to push the stock above established resistance. The chart reflects a stalling setup below key levels, with mixed technical signals creating hesitation for the week ahead.
 104.99
109.95
Highlights
- Shares of Cisco rose 1.29% over seven days to $107.85 but remain below short-term moving averages.
- Technical structure shows weak short-term momentum with a strong sell signal from MACD and neutral RSI readings.
- Cisco shares are expected to trade between $106.35 and $109.04 over the next five days, with a high probability of a decline.
Record revenue and AI deals support sentiment despite resistance struggles
Cisco reported record fiscal year revenue according to Kalkine Media and Yahoo Finance, highlighting advancements in AI-native networking and major AI infrastructure orders. The company returned $12.7 billion to shareholders in fiscal 2026, boosted its dividend for the fifteenth straight year, and sustained sizeable buybacks, as noted by 24/7 Wall St. Strategic moves included a memorandum of understanding with Bell Canada for sovereign AI infrastructure, and a multiyear Notre Dame campus connectivity deal, while the ongoing strength in AI demand remains a factor for sentiment this week.
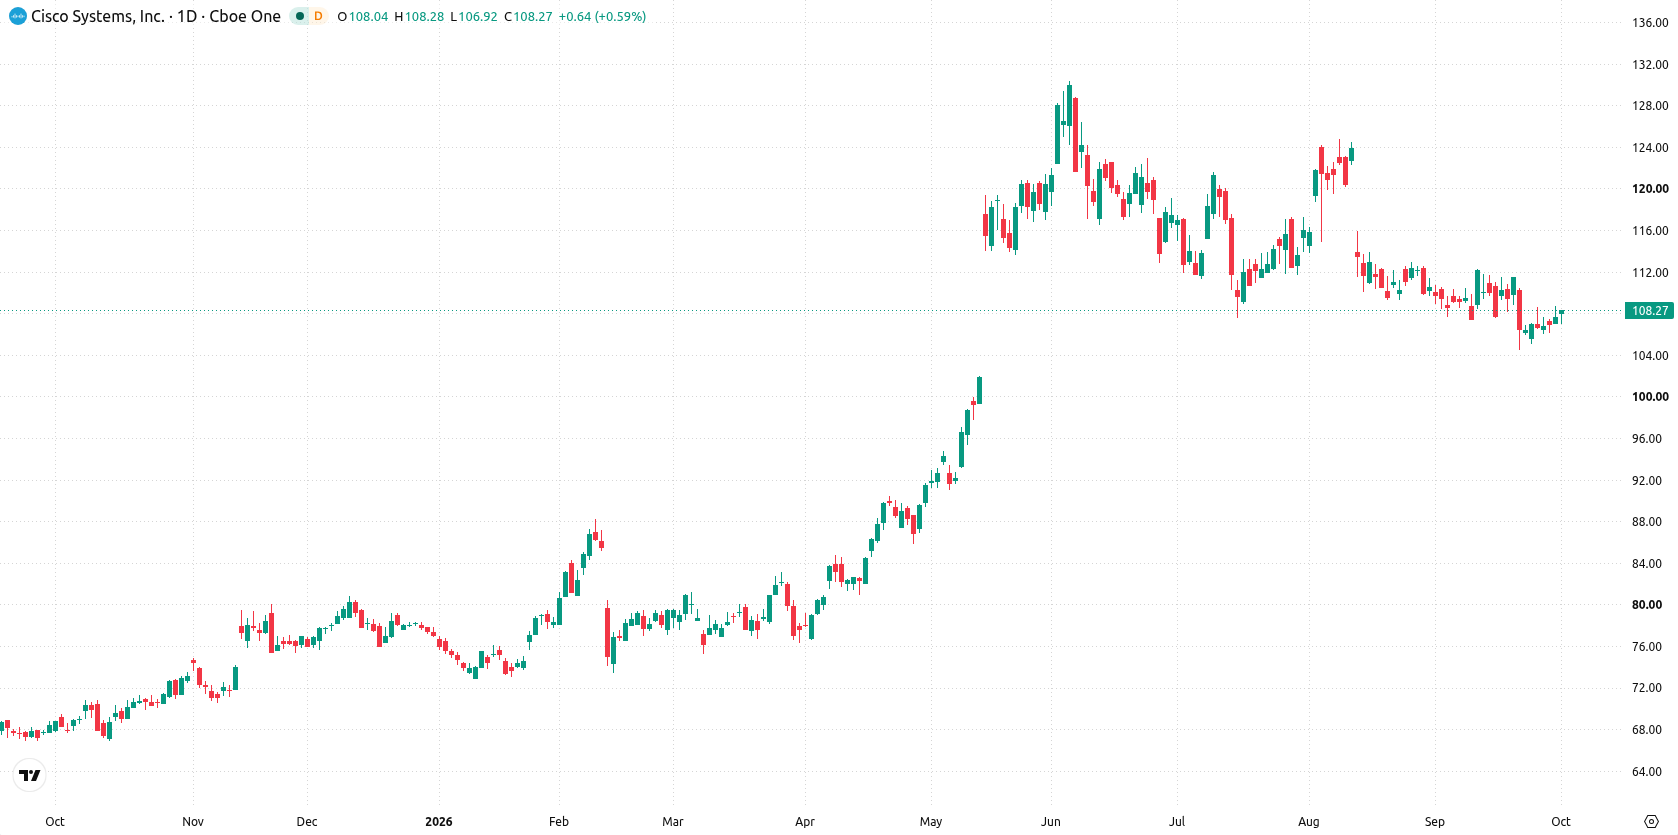
Mixed momentum persists as price holds below moving averages over the week
On the daily chart, the stock is under the key moving averages, signaling near-term pressure despite a constructive longer-term backdrop. Momentum signals are mixed: the MACD projects a strong sell while the RSI holds a neutral reading at 45.08. Volatility for the week came in at 2.52%. Immediate support stands at $106 and resistance at $108.63, with the Ichimoku Kijun at $108.73 acting as an additional resistance level. This reflects an emerging move higher that is not yet confirmed.
Decline risk dominates as price stays confined below key resistance next week
For the next five trading days, expect Cisco shares to trade between $106.35 and $109.04. The probability of an increase is very low (less than 20%), while the probability of a decrease is very high (more than 80%). Base case is continued trading within this range, with potential upside only if the price pushes above $108.63, while a break below $106 would open the way for further downside.
Previously it was reported that Cisco faced ongoing technical weakness and heightened downside risk despite continued innovation and partnership announcements. The current analysis reinforces this cautious view, with mixed momentum indicators and strong resistance suggesting traders should watch the $106 support and $108.63 resistance for potential breakout or breakdown signals in the coming sessions.










-
 Afghanistan
-
 Albania
-
 Algeria
-
 Angola
-
 Argentina
-
 Armenia
-
 Australia
-
 Austria
-
 Azerbaijan
-
 Bahamas
-
 Bahrain
-
 Bangladesh
-
 Belarus
-
 Belgium
-
 Bolivia
-
 Botswana
-
 Brazil
-
 Brunei
-
 Bulgaria
-
 Cambodia
-
 Cameroon
-
 Canada
-
 Chile
-
 China
-
 Colombia
-
 Congo
-
 Costa Rica
-
 Cote d'Ivoire
-
 Croatia
-
 Cuba
-
 Cyprus
-
 Czechia
-
 DR Congo
-
 Denmark
-
 Dominican Republic
-
 Ecuador
-
 Egypt
-
 El Salvador
-
 Estonia
-
 Eswatini
-
 Ethiopia
-
 Finland
-
 France
-
 Georgia
-
 Germany
-
 Ghana
-
 Greece
-
 Haiti
-
 Hong Kong
-
 Hungary
-
 India
-
 Indonesia
-
 Iran, Islamic republic
-
 Iraq
-
 Ireland
-
 Israel
-
 Italy
-
 Jamaica
-
 Japan
-
 Jordan
-
 Kazakhstan
-
 Kenya
-
 Korea
-
 Kuwait
-
 Kyrgyzstan
-
 Laos
-
 Latvia
-
 Lebanon
-
 Lesotho
-
 Libya
-
 Lithuania
-
 Luxembourg
-
 Madagascar
-
 Malaysia
-
 Malta
-
 Mauritius
-
 Mexico
-
 Moldova
-
 Mongolia
-
 Montenegro
-
 Morocco
-
 Mozambique
-
 Myanmar
-
 Namibia
-
 Nepal
-
 Netherlands
-
 New Zealand
-
 Nigeria
-
 North Macedonia
-
 Norway
-
 Oman
-
 Pakistan
-
 Palestine
-
 Panama
-
 Papua New Guinea
-
 Paraguay
-
 Peru
-
 Philippines
-
 Poland
-
 Portugal
-
 Puerto Rico
-
 Qatar
-
 Reunion
-
 Romania
-
 Rwanda
-
 Saudi Arabia
-
 Serbia
-
 Singapore
-
 Slovakia
-
 Slovenia
-
 Somalia
-
 South Africa
-
 Spain
-
 Sri Lanka
-
 Sweden
-
 Switzerland
-
 Syria
-
 Taiwan
-
 Tajikistan
-
 Tanzania
-
 Thailand
-
 Trinidad and Tobago
-
 Tunisia
-
 Turkey
-
 UAE
-
 Uganda
-
 Ukraine
-
 United Kingdom
-
United States
-
 Uruguay
-
 Uzbekistan
-
 Venezuela
-
 Vietnam
-
 Yemen
-
 Zambia
-
 Zimbabwe
- Forex
- Crypto












