

What's behind Bit Digital's latest 3.3% stock pullback?

Bit Digital Inc (BTBT) declined 3.34% as shifting technical momentum and renewed selling pressure weighed on sentiment. The move looks limited, with the stock trading below its 20-day and 200-day moving averages, but above its 50-day level.
 0.7549
0.8749
Highlights
- Shares of Bit Digital are trading below key medium- and long-term moving averages, with resistance at $1.6 and support at $1.52.
- Technical indicators show mixed signals, with building upside momentum but an overall weak trend and neutral momentum readings.
- Price is forecasted to remain between $1.5 and $1.68 in the next five sessions, with a 63% probability of downside movement.
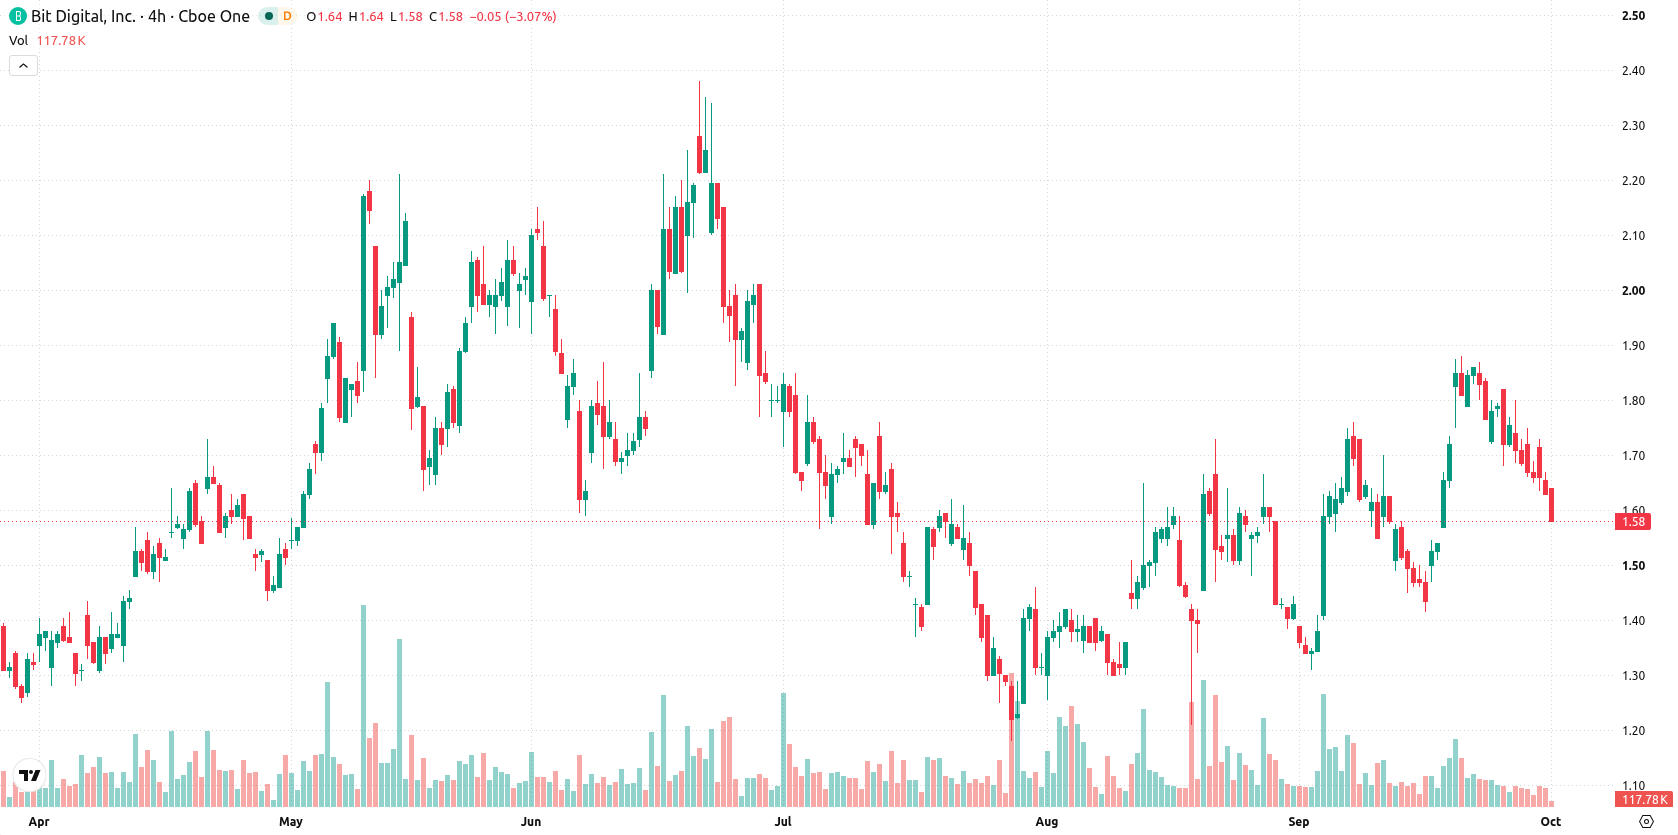
Buyer support holds despite neutral momentum and elevated volatility
Bit Digital is trading below its 20-day moving average at $1.64 and its 200-day moving average at $1.73, but remains above the 50-day at $1.52. This setup indicates continued medium-term support from buyers, yet shows lingering long-term pressure from sellers, with the near-term ceiling at $1.6 (Ichimoku Kijun) and floor at $1.52 (MA-50). Momentum signals from the MACD point to building upside strength, though the ADX indicates a trend lacking conviction. The RSI stands neutral at 50.45 and is forecasting buy, with both the Stochastic RSI and CCI remaining in neutral ranges. Bull/Bear Power at 0.06 reveals buyers still have the upper hand in intraday action, while the Awesome Oscillator provides no clear directional support. The stock is trading at $1.59 after opening with an upside gap of $0.07 (4.24%), nearing the low of its intraday range. Volatility for the session is elevated at 6.13%. The brief move lower by $0.055 or 3.34% after the upside gap reflects renewed selling pressure post-open, contrasting with some short-term momentum signals.
Earlier, analysts noted that Bit Digital was contending with persistent negative momentum and urged close attention to technical boundaries for signs of direction. The current analysis adds that, while some short-term momentum indicators have turned supportive, the risk of a break below $1.52 remains a critical downside factor for traders to monitor in the coming sessions.






Latest Bit Digital News



-
 Afghanistan
-
 Albania
-
 Algeria
-
 Angola
-
 Argentina
-
 Armenia
-
 Australia
-
 Austria
-
 Azerbaijan
-
 Bahamas
-
 Bahrain
-
 Bangladesh
-
 Belarus
-
 Belgium
-
 Bolivia
-
 Botswana
-
 Brazil
-
 Brunei
-
 Bulgaria
-
 Cambodia
-
 Cameroon
-
 Canada
-
 Chile
-
 China
-
 Colombia
-
 Congo
-
 Costa Rica
-
 Cote d'Ivoire
-
 Croatia
-
 Cuba
-
 Cyprus
-
 Czechia
-
 DR Congo
-
 Denmark
-
 Dominican Republic
-
 Ecuador
-
 Egypt
-
 El Salvador
-
 Estonia
-
 Eswatini
-
 Ethiopia
-
 Finland
-
 France
-
 Georgia
-
 Germany
-
 Ghana
-
 Greece
-
 Haiti
-
 Hong Kong
-
 Hungary
-
 India
-
 Indonesia
-
 Iran, Islamic republic
-
 Iraq
-
 Ireland
-
 Israel
-
 Italy
-
 Jamaica
-
 Japan
-
 Jordan
-
 Kazakhstan
-
 Kenya
-
 Korea
-
 Kuwait
-
 Kyrgyzstan
-
 Laos
-
 Latvia
-
 Lebanon
-
 Lesotho
-
 Libya
-
 Lithuania
-
 Luxembourg
-
 Madagascar
-
 Malaysia
-
 Malta
-
 Mauritius
-
 Mexico
-
 Moldova
-
 Mongolia
-
 Montenegro
-
 Morocco
-
 Mozambique
-
 Myanmar
-
 Namibia
-
 Nepal
-
 Netherlands
-
 New Zealand
-
 Nigeria
-
 North Macedonia
-
 Norway
-
 Oman
-
 Pakistan
-
 Palestine
-
 Panama
-
 Papua New Guinea
-
 Paraguay
-
 Peru
-
 Philippines
-
 Poland
-
 Portugal
-
 Puerto Rico
-
 Qatar
-
 Reunion
-
 Romania
-
 Rwanda
-
 Saudi Arabia
-
 Serbia
-
 Singapore
-
 Slovakia
-
 Slovenia
-
 Somalia
-
 South Africa
-
 Spain
-
 Sri Lanka
-
 Sweden
-
 Switzerland
-
 Syria
-
 Taiwan
-
 Tajikistan
-
 Tanzania
-
 Thailand
-
 Trinidad and Tobago
-
 Tunisia
-
 Turkey
-
 UAE
-
 Uganda
-
 Ukraine
-
 United Kingdom
-
United States
-
 Uruguay
-
 Uzbekistan
-
 Venezuela
-
 Vietnam
-
 Yemen
-
 Zambia
-
 Zimbabwe
- Forex
- Crypto












