

Intuit stock weekly forecast: Struggles to hold support at $277.34 amid bearish momentum

Shares of Intuit Inc. (INTU) are trading near $278 as sellers keep pressure on the stock and conditions slip deep into oversold territory. Despite the muted move over the past week, all eyes are on whether support can contain further downside as weak momentum persists into the coming week.
 344.62
366.19
Highlights
- Shares of Intuit have edged up to $278.41 over the past week but remain stuck below key moving averages, confirming a weak longer-term setup.
- Technical indicators show continued bearish momentum but with emerging oversold signals, suggesting downside pressure may be moderating.
- Price is consolidating between support at $277.34 and resistance at $306.94, with a 73% probability of decrease and an expected range of $259.29 to $284.89 next week.
Brand overhaul and AI investment bolster long-term outlook despite near-term caution
INTU made headlines this week with the launch of its new 'One Intuit' unified brand identity, aimed at strengthening integration and highlighting its AI-powered Intuit Intelligence across all products, according to Creative Review. The company also expanded its NFL sponsorship to Credit Karma, secured international rights, and introduced a new IDEAS cohort to support local businesses, as reported by StockTitan and MarketScreener. Recent filings show a 15% increase in the quarterly dividend to $1.38 per share, ongoing share buybacks, and a solid financial position with $7.2 billion in cash and investments versus $7.7 billion in debt, according to Yahoo Finance. Long-term strategy outlined at the latest investor day points to further investment in AI-driven initiatives and customer acquisition, with full-year revenue up 14% in fiscal 2026, according to Yahoo Finance and Seeking Alpha.
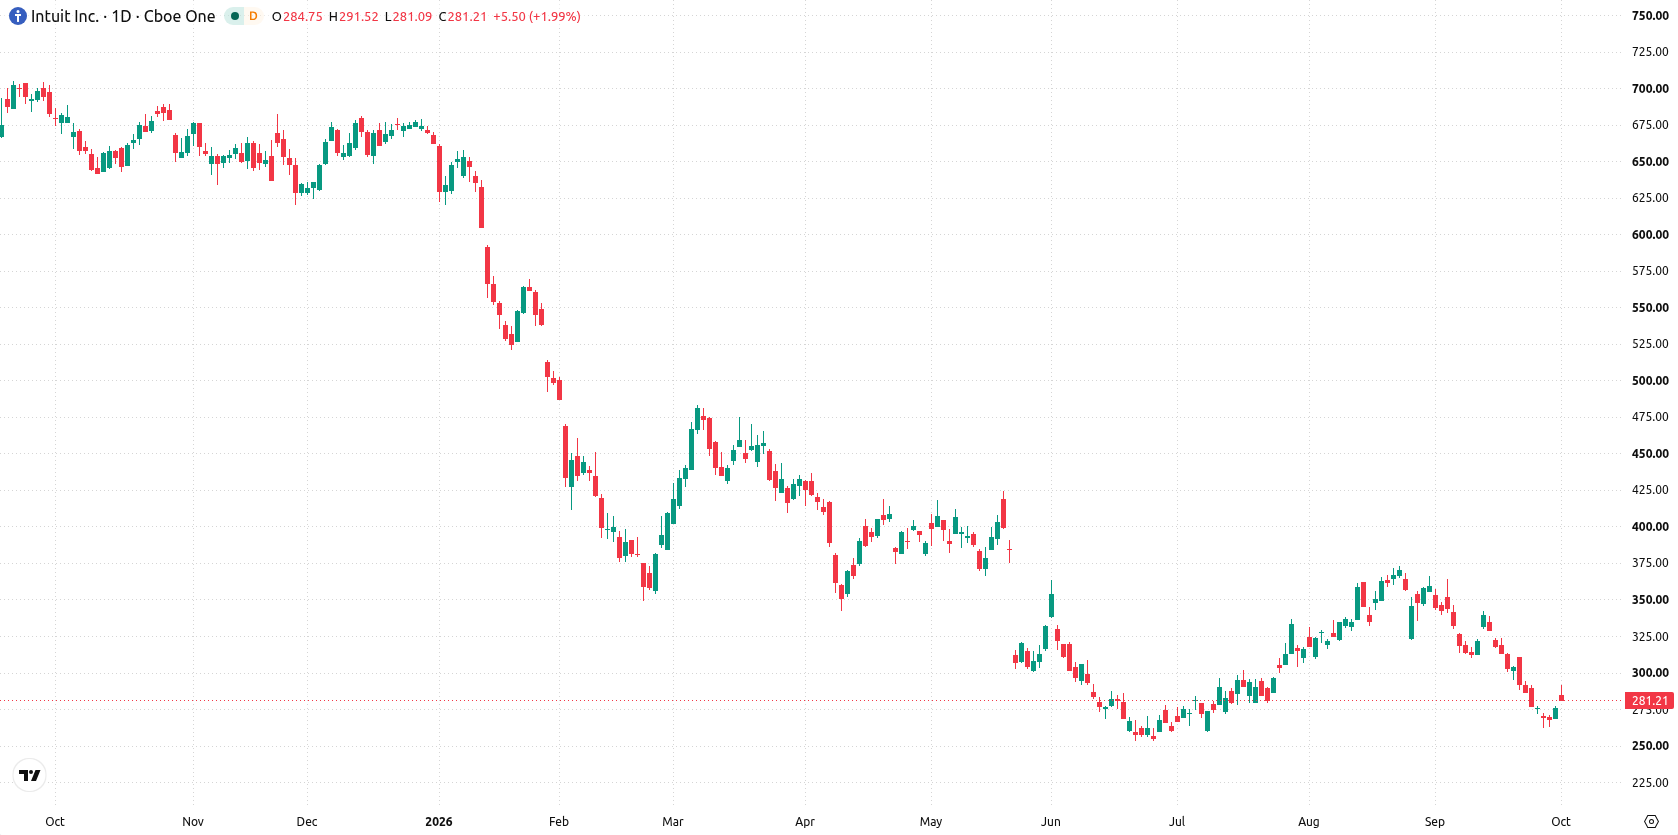
Downside pressure moderates as oversold signals and firm support shape weekly action
On the daily chart, the setup shows continued weakness, with RSI at 33.07 approaching oversold and CCI already registering an oversold reading at -103.39. Momentum remains bearish, as flagged by MACD Sell, while volatility over the past week measured 5.52%. Price is sitting directly on support at $277.34, with the nearest resistance at the 20-day moving average of $306.94 and the Ichimoku Kijun at $312.55 acting as a further ceiling. This points to a contained move within a narrow range, with sellers still dominant but the oversold signals suggesting downside may be losing steam.
Consolidation expected unless support breaks or resistance yields next week
Next week, the expected range is $259.29 to $284.89, with a 27% probability of an increase and a 73% probability of a decrease. The base case is continued consolidation between support at $277.34 and resistance at $306.94. A break above $306.94 would open up room for a recovery toward the Kijun and higher levels. A sustained drop below $277.34 support could bring further declines toward the $259.29 range low.
Earlier, analysts noted that Intuit shares appeared set for consolidation, as mixed technical signals kept the stock in a range-bound outlook. The latest readings now underscore persisting downside risk with sellers exerting pressure near key support, making a potential break below $277.34 an important level to monitor in the days ahead.










-
 Afghanistan
-
 Albania
-
 Algeria
-
 Angola
-
 Argentina
-
 Armenia
-
 Australia
-
 Austria
-
 Azerbaijan
-
 Bahamas
-
 Bahrain
-
 Bangladesh
-
 Belarus
-
 Belgium
-
 Bolivia
-
 Botswana
-
 Brazil
-
 Brunei
-
 Bulgaria
-
 Cambodia
-
 Cameroon
-
 Canada
-
 Chile
-
 China
-
 Colombia
-
 Congo
-
 Costa Rica
-
 Cote d'Ivoire
-
 Croatia
-
 Cuba
-
 Cyprus
-
 Czechia
-
 DR Congo
-
 Denmark
-
 Dominican Republic
-
 Ecuador
-
 Egypt
-
 El Salvador
-
 Estonia
-
 Eswatini
-
 Ethiopia
-
 Finland
-
 France
-
 Georgia
-
 Germany
-
 Ghana
-
 Greece
-
 Haiti
-
 Hong Kong
-
 Hungary
-
 India
-
 Indonesia
-
 Iran, Islamic republic
-
 Iraq
-
 Ireland
-
 Israel
-
 Italy
-
 Jamaica
-
 Japan
-
 Jordan
-
 Kazakhstan
-
 Kenya
-
 Korea
-
 Kuwait
-
 Kyrgyzstan
-
 Laos
-
 Latvia
-
 Lebanon
-
 Lesotho
-
 Libya
-
 Lithuania
-
 Luxembourg
-
 Madagascar
-
 Malaysia
-
 Malta
-
 Mauritius
-
 Mexico
-
 Moldova
-
 Mongolia
-
 Montenegro
-
 Morocco
-
 Mozambique
-
 Myanmar
-
 Namibia
-
 Nepal
-
 Netherlands
-
 New Zealand
-
 Nigeria
-
 North Macedonia
-
 Norway
-
 Oman
-
 Pakistan
-
 Palestine
-
 Panama
-
 Papua New Guinea
-
 Paraguay
-
 Peru
-
 Philippines
-
 Poland
-
 Portugal
-
 Puerto Rico
-
 Qatar
-
 Reunion
-
 Romania
-
 Rwanda
-
 Saudi Arabia
-
 Serbia
-
 Singapore
-
 Slovakia
-
 Slovenia
-
 Somalia
-
 South Africa
-
 Spain
-
 Sri Lanka
-
 Sweden
-
 Switzerland
-
 Syria
-
 Taiwan
-
 Tajikistan
-
 Tanzania
-
 Thailand
-
 Trinidad and Tobago
-
 Tunisia
-
 Turkey
-
 UAE
-
 Uganda
-
 Ukraine
-
 United Kingdom
-
United States
-
 Uruguay
-
 Uzbekistan
-
 Venezuela
-
 Vietnam
-
 Yemen
-
 Zambia
-
 Zimbabwe
- Forex
- Crypto












