

Intuit stock tests $287.26 resistance amid unified brand identity rollout

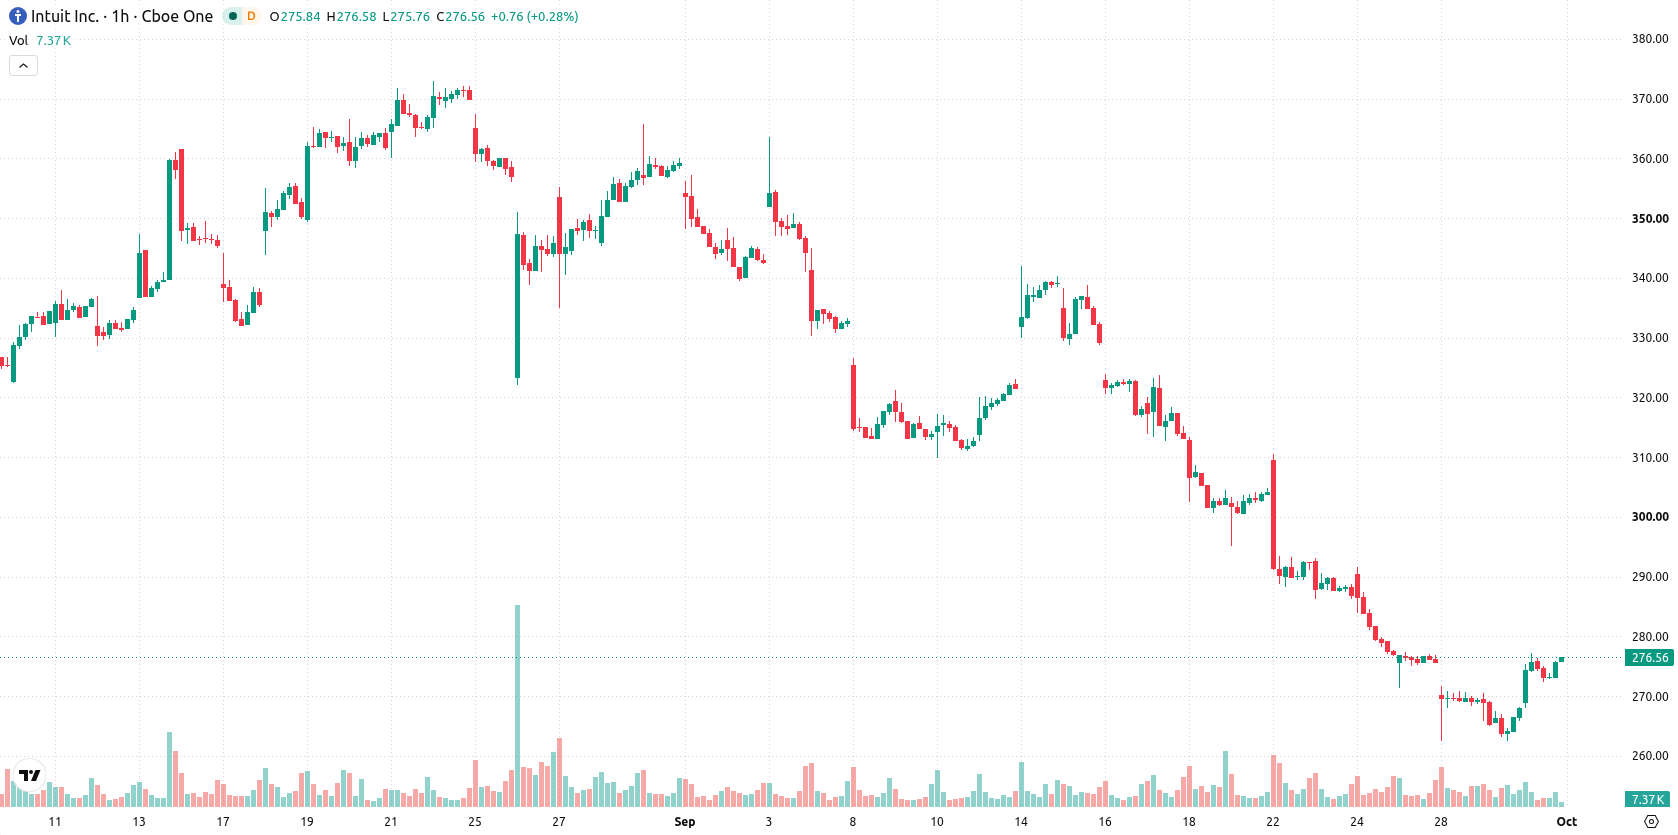
Intuit Inc. (INTU) stock is trading at $276.16, up 3.03% on the day and closing near session highs. The stock is currently trading above its key moving averages in the short term, reflecting ongoing buying interest after today's gap higher.
 351.38
345.68
Highlights
- Intuit integrated Solera Global's Qapter with QuickBooks Online, automating job costing for repair shops and expanding its financial product use cases.
- Intuit's financial intelligence now powers Meta's new AI assistant and its unified brand initiative seeks to build customer loyalty across offerings.
- Shares of Intuit climbed 3.03% to $276.16, but technicals indicate persistent medium- and long-term bearish conditions, with the price expected between $265.06 and $287.26.
Customer loyalty and demand seen rising as workflow integrations expand
Intuit has deepened its QuickBooks Online ecosystem by integrating Solera Global Corp.'s Qapter platform, allowing repair shops to connect estimating tools directly with QuickBooks Online for more automated job costing and bookkeeping, according to Simplywall. This development enhances workflow efficiency for a key business segment, likely stimulating demand for Intuit's financial products. Additionally, Intuit's financial intelligence services are now embedded within Meta’s new AI assistant, broadening Intuit’s reach into digital financial workflows, as reported by Pymnts. The recent rollout of a unified ‘One Intuit’ brand identity aligns the company’s offerings under a consolidated design and branding approach, potentially reinforcing customer loyalty.
Mixed signals as selling momentum clashes with buy-side indicators
Technical analysis shows INTU trading above the MA-20 at $270.18, but it remains below the MA-50 at $280.97 on the hourly chart and beneath the MA-200 at $399.5 on the daily chart. Immediate technical support is established at the Ichimoku Kijun level of $270.78, while the current trading range is framed by recent action. Among indicators, MACD and ADX both signal pronounced selling momentum, while RSI sits at a neutral 51.51 and CCI suggests a buy. Stochastic RSI points to overbought conditions, with Bull/Bear Power and Stochastic RSI showing buyer dominance and overheated intraday readings. Awesome Oscillator remains neutral, indicating a divergence between oscillator signals and momentum trends.
Range-bound outlook as resistance and support define path
Over the next two to three trading days, INTU is expected to consolidate within a volatility band from $265.06 to $287.26. Model probabilities put a 41% chance of an uptick versus a 59% likelihood of retracement. The baseline scenario anticipates range-bound movement, with bullish momentum requiring a break above the $287.26 resistance for further upside, while a bearish move below the $270.78 support would target the lower end of the current range at $265.06.
Previously it was reported that Intuit faced ongoing downside risk amid persistent bearish technical signals despite solid revenue growth and new product initiatives. The latest developments highlight a more balanced technical setup as the stock trades above short-term averages, but with a majority probability favoring consolidation or retracement, a move above $287.26 remains the key trigger for sustained upside momentum.











-
 Afghanistan
-
 Albania
-
 Algeria
-
 Angola
-
 Argentina
-
 Armenia
-
 Australia
-
 Austria
-
 Azerbaijan
-
 Bahamas
-
 Bahrain
-
 Bangladesh
-
 Belarus
-
 Belgium
-
 Bolivia
-
 Botswana
-
 Brazil
-
 Brunei
-
 Bulgaria
-
 Cambodia
-
 Cameroon
-
 Canada
-
 Chile
-
 China
-
 Colombia
-
 Congo
-
 Costa Rica
-
 Cote d'Ivoire
-
 Croatia
-
 Cuba
-
 Cyprus
-
 Czechia
-
 DR Congo
-
 Denmark
-
 Dominican Republic
-
 Ecuador
-
 Egypt
-
 El Salvador
-
 Estonia
-
 Eswatini
-
 Ethiopia
-
 Finland
-
 France
-
 Georgia
-
 Germany
-
 Ghana
-
 Greece
-
 Haiti
-
 Hong Kong
-
 Hungary
-
 India
-
 Indonesia
-
 Iran, Islamic republic
-
 Iraq
-
 Ireland
-
 Israel
-
 Italy
-
 Jamaica
-
 Japan
-
 Jordan
-
 Kazakhstan
-
 Kenya
-
 Korea
-
 Kuwait
-
 Kyrgyzstan
-
 Laos
-
 Latvia
-
 Lebanon
-
 Lesotho
-
 Libya
-
 Lithuania
-
 Luxembourg
-
 Madagascar
-
 Malaysia
-
 Malta
-
 Mauritius
-
 Mexico
-
 Moldova
-
 Mongolia
-
 Montenegro
-
 Morocco
-
 Mozambique
-
 Myanmar
-
 Namibia
-
 Nepal
-
 Netherlands
-
 New Zealand
-
 Nigeria
-
 North Macedonia
-
 Norway
-
 Oman
-
 Pakistan
-
 Palestine
-
 Panama
-
 Papua New Guinea
-
 Paraguay
-
 Peru
-
 Philippines
-
 Poland
-
 Portugal
-
 Puerto Rico
-
 Qatar
-
 Reunion
-
 Romania
-
 Rwanda
-
 Saudi Arabia
-
 Serbia
-
 Singapore
-
 Slovakia
-
 Slovenia
-
 Somalia
-
 South Africa
-
 Spain
-
 Sri Lanka
-
 Sweden
-
 Switzerland
-
 Syria
-
 Taiwan
-
 Tajikistan
-
 Tanzania
-
 Thailand
-
 Trinidad and Tobago
-
 Tunisia
-
 Turkey
-
 UAE
-
 Uganda
-
 Ukraine
-
 United Kingdom
-
United States
-
 Uruguay
-
 Uzbekistan
-
 Venezuela
-
 Vietnam
-
 Yemen
-
 Zambia
-
 Zimbabwe
- Forex
- Crypto












