

Riot Platforms shares technical analysis: $17.84 support under pressure as selloff continues

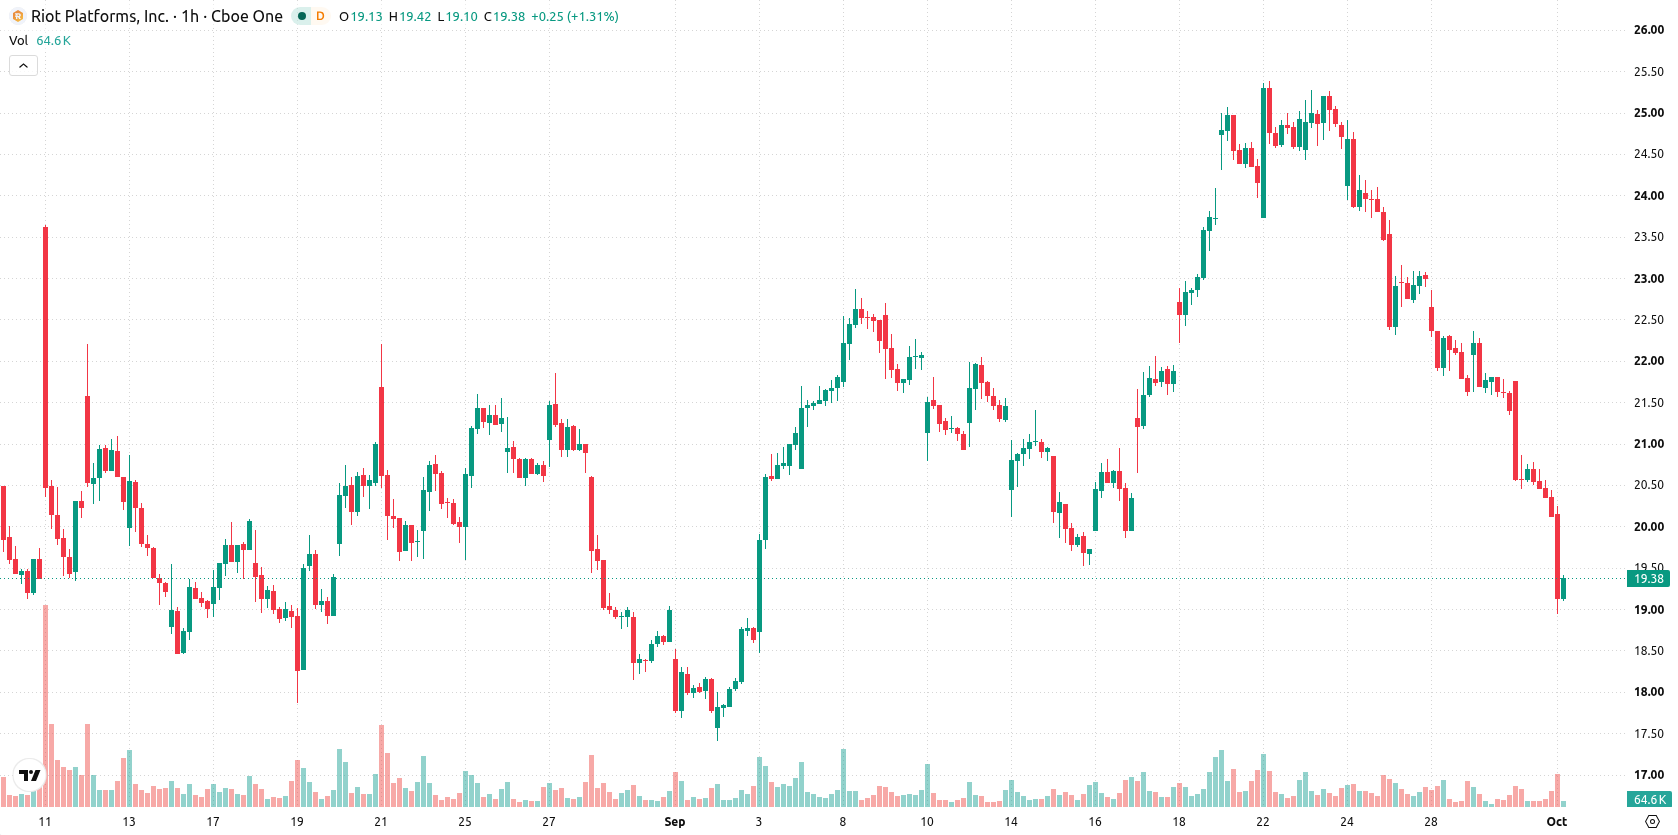
Riot Platforms (RIOT) stock is trading at $19.32, down 4.32% on the day. The price sits below its key moving averages, signaling a negative shift in short- and medium-term momentum while remaining close to long-term support.
 13.00
14.44
Highlights
- RIOT/USD trades below key short- and medium-term moving averages, with long-term support found near the 200-day level.
- Bearish momentum dominates, with oversold technical readings and strong seller control aligning with high intraday volatility.
- Expected trading range for several days is $17.84 to $20.8, with a 22% chance of an upward move and increased risk of further decline.
Oversold conditions persist as selling pressure dominates technicals
On the daily chart, RIOT trades below the MA-20 at $21.37 and MA-50 at $23.01, with the MA-200 at $19.29 providing nearby support. The Ichimoku Kijun level at $21.66 acts as immediate resistance. Intraday momentum is weak, with both MACD and ADX indicating selling pressure on the H1 timeframe. RSI is deeply oversold at 23.96, while CCI and Stoch RSI also signal oversold conditions, suggesting a stretched decline. Bull/Bear Power highlights seller dominance within the session. Awesome Oscillator remains neutral and offers no clear direction amid current price action.
Weakness likely to extend unless resistance is reclaimed
Over the next several days, RIOT is expected to move within a typical volatility range of $17.84 to $20.8. The probability of an upward move is estimated at 22%, pointing to a higher likelihood of continued weakness. If price rebounds above $21.66, a short-term rally could be triggered. Conversely, a drop below $17.84 would indicate a sustained downtrend in the short run.
Earlier, analysts noted that Riot Platforms was exhibiting persistent downside risks amid weakening short- and medium-term momentum. The latest price action reinforces this bearish outlook, with traders advised to closely monitor the $17.84 support level for signs of further downside acceleration.









-
 Afghanistan
-
 Albania
-
 Algeria
-
 Angola
-
 Argentina
-
 Armenia
-
 Australia
-
 Austria
-
 Azerbaijan
-
 Bahamas
-
 Bahrain
-
 Bangladesh
-
 Belarus
-
 Belgium
-
 Bolivia
-
 Botswana
-
 Brazil
-
 Brunei
-
 Bulgaria
-
 Cambodia
-
 Cameroon
-
 Canada
-
 Chile
-
 China
-
 Colombia
-
 Congo
-
 Costa Rica
-
 Cote d'Ivoire
-
 Croatia
-
 Cuba
-
 Cyprus
-
 Czechia
-
 DR Congo
-
 Denmark
-
 Dominican Republic
-
 Ecuador
-
 Egypt
-
 El Salvador
-
 Estonia
-
 Eswatini
-
 Ethiopia
-
 Finland
-
 France
-
 Georgia
-
 Germany
-
 Ghana
-
 Greece
-
 Haiti
-
 Hong Kong
-
 Hungary
-
 India
-
 Indonesia
-
 Iran, Islamic republic
-
 Iraq
-
 Ireland
-
 Israel
-
 Italy
-
 Jamaica
-
 Japan
-
 Jordan
-
 Kazakhstan
-
 Kenya
-
 Korea
-
 Kuwait
-
 Kyrgyzstan
-
 Laos
-
 Latvia
-
 Lebanon
-
 Lesotho
-
 Libya
-
 Lithuania
-
 Luxembourg
-
 Madagascar
-
 Malaysia
-
 Malta
-
 Mauritius
-
 Mexico
-
 Moldova
-
 Mongolia
-
 Montenegro
-
 Morocco
-
 Mozambique
-
 Myanmar
-
 Namibia
-
 Nepal
-
 Netherlands
-
 New Zealand
-
 Nigeria
-
 North Macedonia
-
 Norway
-
 Oman
-
 Pakistan
-
 Palestine
-
 Panama
-
 Papua New Guinea
-
 Paraguay
-
 Peru
-
 Philippines
-
 Poland
-
 Portugal
-
 Puerto Rico
-
 Qatar
-
 Reunion
-
 Romania
-
 Rwanda
-
 Saudi Arabia
-
 Serbia
-
 Singapore
-
 Slovakia
-
 Slovenia
-
 Somalia
-
 South Africa
-
 Spain
-
 Sri Lanka
-
 Sweden
-
 Switzerland
-
 Syria
-
 Taiwan
-
 Tajikistan
-
 Tanzania
-
 Thailand
-
 Trinidad and Tobago
-
 Tunisia
-
 Turkey
-
 UAE
-
 Uganda
-
 Ukraine
-
 United Kingdom
-
United States
-
 Uruguay
-
 Uzbekistan
-
 Venezuela
-
 Vietnam
-
 Yemen
-
 Zambia
-
 Zimbabwe
- Forex
- Crypto












