

Salesforce stock consolidates within recent range with momentum signals mixed: weekly analysis

Shares of Salesforce, Inc. (CRM) are trading near $232 after declining around 1% over the past week, with the latest move stretching further into oversold territory. The chart signals conflict, as momentum tilts lower but some technical indicators suggest a reversal could emerge. Uncertainty remains elevated, setting up another volatile week ahead.
 244.64
252.30
Highlights
- Shares of Salesforce fell 1% over the past week to $231.99, now trading below the short-term moving average but above longer-term trend levels.
- Technical indicators show a mix of oversold signals and buy momentum, creating uncertainty about near-term direction and the possibility for either further decline or reversal.
- For the next five sessions, expected range is $224.43 to $239.54, with a close above $235.19 indicating recovery and below $222.42 increasing downside risk.
AI expansion and record Agentforce growth shape sentiment amid earnings and buybacks
Salesforce closed its acquisitions of Listen Labs and Fin (formerly Intercom) in September 2026, expanding its AI footprint within CRM and Agentforce platforms, according to Yahoo Finance and MarTech. The company also introduced new AI products, including the Koa reasoning model developed with Nvidia and enhanced third-party AI integrations in its Marketing Cloud Next, as reported by Yahoo Finance. Salesforce raised its fiscal 2027 revenue outlook following strong second-quarter results and record Agentforce AI product growth, detailed by Simply Wall St and Kalkine.ca, while also repurchasing shares and paying dividends amid debate over the future impact of AI and rising corporate debt, according to Yahoo Finance and Trefis.
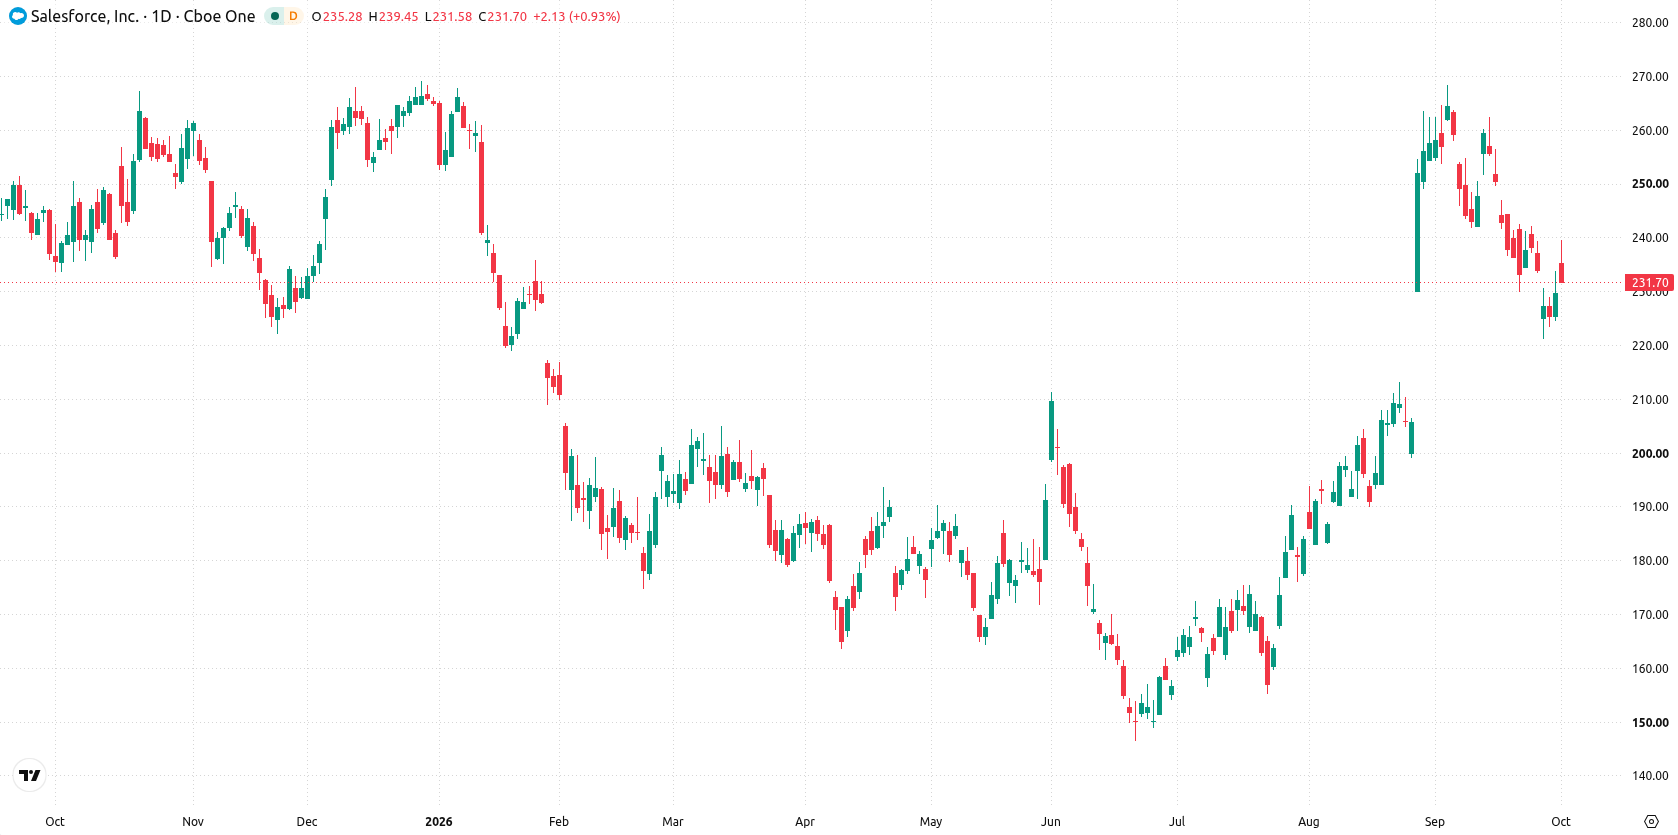
Mixed momentum signals as MACD flips bullish but CCI and Stoch RSI stay oversold
On the daily chart, the setup reflects a developing trend as price consolidates in the middle of a volatile 7.6% weekly range. The MACD is in “buy” territory, yet momentum signals are divided, with both the CCI (-100.46) and Stoch RSI (13.58) in oversold zones, hinting at emerging downside risk but also potential for reversal. Price faces initial resistance at $235.19, marked by the Ichimoku Kijun, while support stands at $222.42. This creates a tactical backdrop where an emerging move lower is not yet confirmed and volatility remains elevated.
Recovery bias emerges if resistance breaks but downside risk grows below support next week
For the next five trading days, the expected range is $224.43 to $239.54, with a 61% probability of an increase and a 39% chance of decline. The base case is for shares to remain broadly within this range, with moves capped by $235.19 resistance and $222.42 support. A close above $235.19 would indicate the start of a recovery and open up further upside. Should the price fall below $222.42, further losses are likely as downside momentum accelerates.
Earlier, analysts noted that Salesforce was consolidating as technical indicators remained mixed and the company expanded its AI capabilities through acquisitions and new product launches. The current analysis adds evidence of sustained volatility with a developing trend, highlighting $235.19 resistance and $222.42 support as critical levels to watch for a confirmed breakout or breakdown in the coming sessions.











-
 Afghanistan
-
 Albania
-
 Algeria
-
 Angola
-
 Argentina
-
 Armenia
-
 Australia
-
 Austria
-
 Azerbaijan
-
 Bahamas
-
 Bahrain
-
 Bangladesh
-
 Belarus
-
 Belgium
-
 Bolivia
-
 Botswana
-
 Brazil
-
 Brunei
-
 Bulgaria
-
 Cambodia
-
 Cameroon
-
 Canada
-
 Chile
-
 China
-
 Colombia
-
 Congo
-
 Costa Rica
-
 Cote d'Ivoire
-
 Croatia
-
 Cuba
-
 Cyprus
-
 Czechia
-
 DR Congo
-
 Denmark
-
 Dominican Republic
-
 Ecuador
-
 Egypt
-
 El Salvador
-
 Estonia
-
 Eswatini
-
 Ethiopia
-
 Finland
-
 France
-
 Georgia
-
 Germany
-
 Ghana
-
 Greece
-
 Haiti
-
 Hong Kong
-
 Hungary
-
 India
-
 Indonesia
-
 Iran, Islamic republic
-
 Iraq
-
 Ireland
-
 Israel
-
 Italy
-
 Jamaica
-
 Japan
-
 Jordan
-
 Kazakhstan
-
 Kenya
-
 Korea
-
 Kuwait
-
 Kyrgyzstan
-
 Laos
-
 Latvia
-
 Lebanon
-
 Lesotho
-
 Libya
-
 Lithuania
-
 Luxembourg
-
 Madagascar
-
 Malaysia
-
 Malta
-
 Mauritius
-
 Mexico
-
 Moldova
-
 Mongolia
-
 Montenegro
-
 Morocco
-
 Mozambique
-
 Myanmar
-
 Namibia
-
 Nepal
-
 Netherlands
-
 New Zealand
-
 Nigeria
-
 North Macedonia
-
 Norway
-
 Oman
-
 Pakistan
-
 Palestine
-
 Panama
-
 Papua New Guinea
-
 Paraguay
-
 Peru
-
 Philippines
-
 Poland
-
 Portugal
-
 Puerto Rico
-
 Qatar
-
 Reunion
-
 Romania
-
 Rwanda
-
 Saudi Arabia
-
 Serbia
-
 Singapore
-
 Slovakia
-
 Slovenia
-
 Somalia
-
 South Africa
-
 Spain
-
 Sri Lanka
-
 Sweden
-
 Switzerland
-
 Syria
-
 Taiwan
-
 Tajikistan
-
 Tanzania
-
 Thailand
-
 Trinidad and Tobago
-
 Tunisia
-
 Turkey
-
 UAE
-
 Uganda
-
 Ukraine
-
 United Kingdom
-
United States
-
 Uruguay
-
 Uzbekistan
-
 Venezuela
-
 Vietnam
-
 Yemen
-
 Zambia
-
 Zimbabwe
- Forex
- Crypto












