

Salesforce shares technical analysis: Weak momentum and seller pressure point to further downside risk

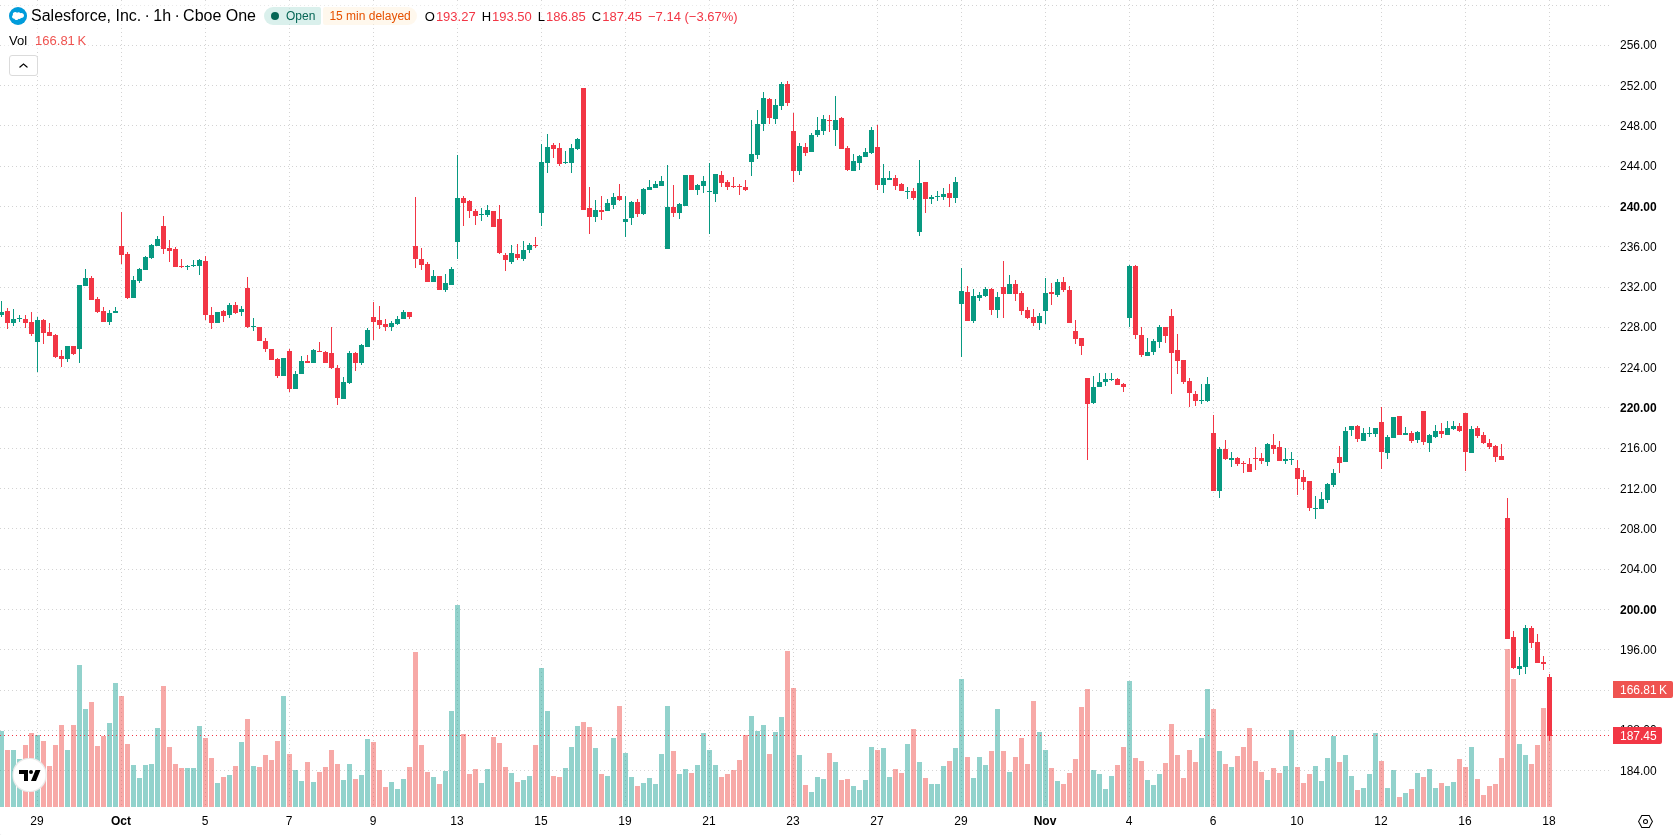
Salesforce (CRM) stock is trading at $188.11, down 3.3% on the day and showing a clear move lower. The price is situated below its key moving averages, indicating persistent downside pressure.
 190.54
219.22
Highlights
- Salesforce and Microsoft announced a strategic partnership to integrate Salesforce business data and workflows into Microsoft Copilot, Teams, and Fabric.
- Salesforce began another round of layoffs affecting multiple teams, following 86 job cuts in California in August 2026, as part of cost adjustments.
- Shares of Salesforce traded near today’s low at $188.11, down 3.3% with strong downside momentum and a projected range of $176.62 to $199.6 over the next several days.
Collaborative integration and layoffs as competitive conditions shift
Salesforce and Microsoft launched a strategic partnership, Copilotforce, on November 17, 2026, integrating Salesforce business data and workflows into Microsoft Copilot, Teams, and Fabric. According to Salesforce, the integration aims to deepen enterprise collaboration by connecting customer context and sales actions across platforms, which could boost client engagement and retention for both partners. In addition, Salesforce initiated a new round of layoffs affecting multiple teams, and previously reported 86 job cuts in California in August 2026, according to Yahoo Finance, suggesting ongoing cost adjustment measures in response to an evolving competitive landscape.
Downside momentum dominates as oversold signals begin to emerge
Technically, CRM is trading below the H1 SMA-20 at $208.25 and the H1 SMA-50 at $212.65, in addition to being below the D1 SMA-200 at $197.9. The Ichimoku Kijun on the same timeframe sits at $206.71 and is acting as immediate resistance. Indicator readings show that both MACD and ADX are bearish, while RSI is in the oversold zone, hinting at selling exhaustion. Stoch RSI and CCI remain neutral, and Bull/Bear Power is distinctly negative at -6.63, reflecting intraday dominance by sellers amid mixed signals from oversold conditions contrasting with ongoing downside momentum.
High downside risk with limited bullish potential amid volatility
In the short term, trading is expected within the $176.62 to $199.6 band, reflecting the current volatility environment. The probability of an upside breakout is assessed as very low, with the chance of further downside developments considered very high. Continuation of sideways activity forms the base scenario, while a bullish move would require a decisive break above the $206.71 resistance. On the downside, a clear drop through $176.62 could trigger further declines before the next rebound attempt.
Previously it was reported that Salesforce faced persistent downside pressure despite the announcement of its Copilotforce partnership with Microsoft. The latest developments reinforce this bearish technical outlook, with continued weakness below major moving averages and a clear short-term risk of extension toward the lower end of the prevailing $176.62-$199.6 trading band.






Latest Salesforce News





-
 Afghanistan
-
 Albania
-
 Algeria
-
 Angola
-
 Argentina
-
 Armenia
-
 Australia
-
 Austria
-
 Azerbaijan
-
 Bahamas
-
 Bahrain
-
 Bangladesh
-
 Belarus
-
 Belgium
-
 Bolivia
-
 Botswana
-
 Brazil
-
 Brunei
-
 Bulgaria
-
 Cambodia
-
 Cameroon
-
 Canada
-
 Chile
-
 China
-
 Colombia
-
 Congo
-
 Costa Rica
-
 Cote d'Ivoire
-
 Croatia
-
 Cuba
-
 Cyprus
-
 Czechia
-
 DR Congo
-
 Denmark
-
 Dominican Republic
-
 Ecuador
-
 Egypt
-
 El Salvador
-
 Estonia
-
 Eswatini
-
 Ethiopia
-
 Finland
-
 France
-
 Georgia
-
 Germany
-
 Ghana
-
 Greece
-
 Haiti
-
 Hong Kong
-
 Hungary
-
 India
-
 Indonesia
-
 Iran, Islamic republic
-
 Iraq
-
 Ireland
-
 Israel
-
 Italy
-
 Jamaica
-
 Japan
-
 Jordan
-
 Kazakhstan
-
 Kenya
-
 Korea
-
 Kuwait
-
 Kyrgyzstan
-
 Laos
-
 Latvia
-
 Lebanon
-
 Lesotho
-
 Libya
-
 Lithuania
-
 Luxembourg
-
 Madagascar
-
 Malaysia
-
 Malta
-
 Mauritius
-
 Mexico
-
 Moldova
-
 Mongolia
-
 Montenegro
-
 Morocco
-
 Mozambique
-
 Myanmar
-
 Namibia
-
 Nepal
-
 Netherlands
-
 New Zealand
-
 Nigeria
-
 North Macedonia
-
 Norway
-
 Oman
-
 Pakistan
-
 Palestine
-
 Panama
-
 Papua New Guinea
-
 Paraguay
-
 Peru
-
 Philippines
-
 Poland
-
 Portugal
-
 Puerto Rico
-
 Qatar
-
 Reunion
-
 Romania
-
 Rwanda
-
 Saudi Arabia
-
 Serbia
-
 Singapore
-
 Slovakia
-
 Slovenia
-
 Somalia
-
 South Africa
-
 Spain
-
 Sri Lanka
-
 Sweden
-
 Switzerland
-
 Syria
-
 Taiwan
-
 Tajikistan
-
 Tanzania
-
 Thailand
-
 Trinidad and Tobago
-
 Tunisia
-
 Turkey
-
 UAE
-
 Uganda
-
 Ukraine
-
 United Kingdom
-
United States
-
 Uruguay
-
 Uzbekistan
-
 Venezuela
-
 Vietnam
-
 Yemen
-
 Zambia
-
 Zimbabwe
- Forex
- Crypto












