

Salesforce stock decline reaches oversold territory with rebound risk: weekly analysis

Shares of Salesforce, Inc. (CRM) are trading near $215 after slipping around 1% over the past week, as sellers drove the stock into oversold territory. Technical signals point to mounting downside momentum, but oversold readings also hint at the risk of a short-term rebound heading into the new week.
 219.20
219.22
Highlights
- Shares of Salesforce fell 1.29% over the last seven days and moved below key short-term averages.
- The stock currently trades in a narrow range with low momentum and a bearish-to-neutral chart structure.
- Salesforce stock is expected to consolidate between $210.4 and $219.93, with a 77% chance of further declines and $208.97 as key support.
Mixed institutional flows drive portfolio shifts as valuation debate sharpens
Institutional activity was mixed this week, as Banco Santander S.A. significantly increased its CRM stake, while Aberdeen Group plc, Hantz Financial Services Inc., and Danske Bank A S reduced their positions, according to MarketBeat. White Pine Capital LLC and Migdal Insurance & Financial Holdings Ltd. also disclosed new CRM holdings, reflecting continued institutional interest alongside portfolio reshuffling. TheStreet reports that CEO Marc Benioff remains the largest individual shareholder, with the company’s valuation drawing attention as investor allocations evolve.
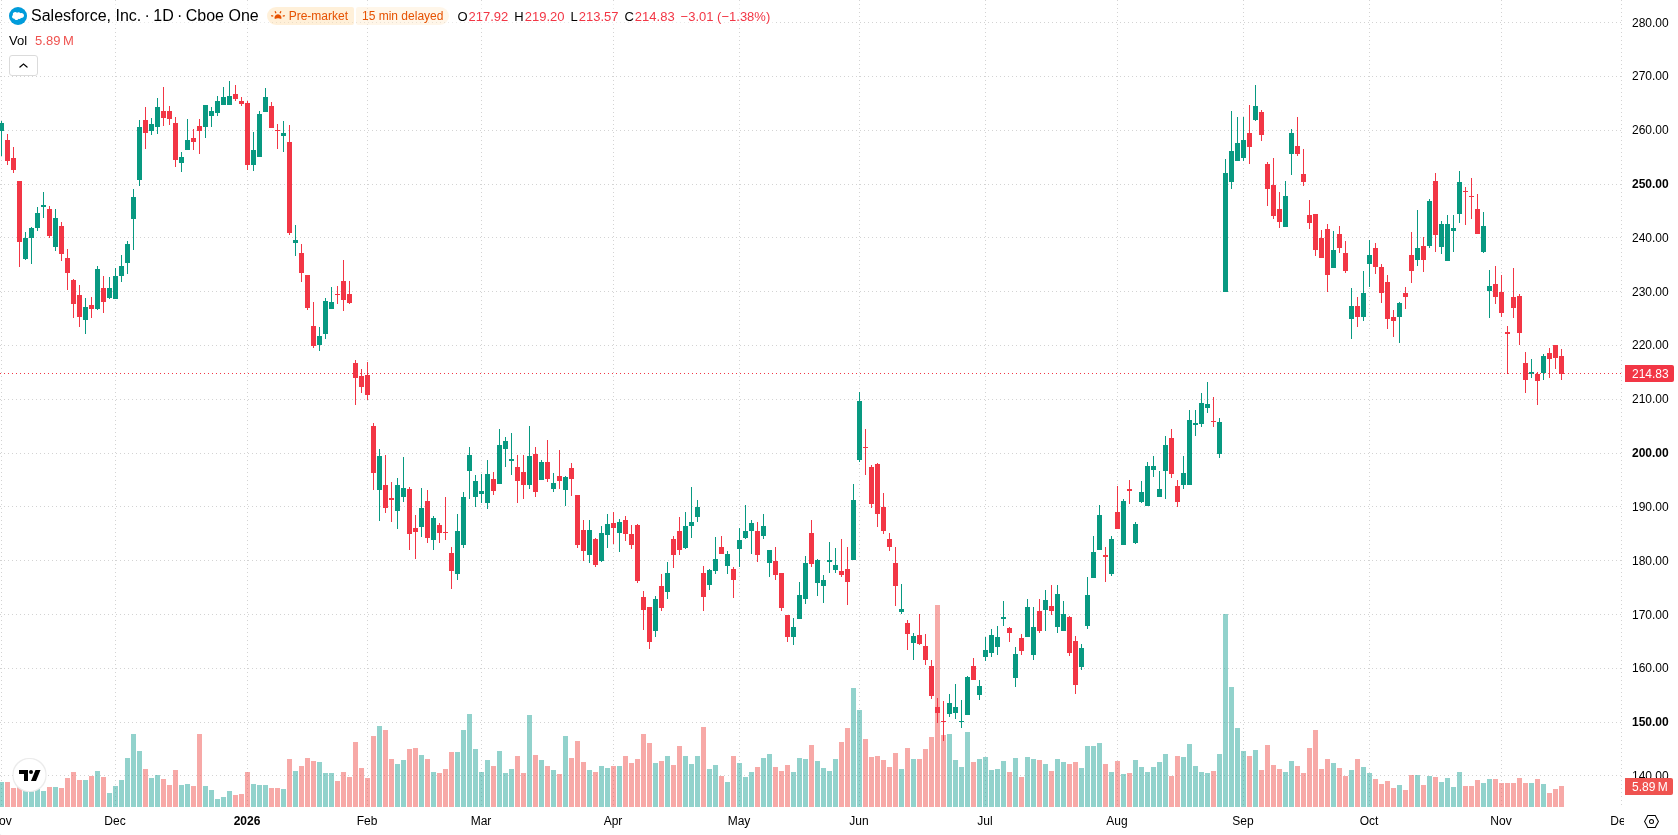
Narrow range holds as MACD sell signal persists and oversold risk builds
On the daily chart, momentum is characterized by a contained move within a narrow range, with volatility over the past week at 4.91%. The MACD remains in a sell configuration at -7.49, while Stochastic RSI is in the oversold zone at 16.29, pointing to possible rebound risk despite overall downward pressure. Nearest support lies at $208.97, with resistance at $219.22 and the Ichimoku Kijun at $230.64 acting as additional resistance.
Consolidation favored unless resistance or support levels break next week
Over the next five trading days, the stock is expected to move within a $210.4 to $219.93 range, with a 23% probability of an increase and a 77% probability of a decrease. The base case is further consolidation between $208.97 and $219.22. A move above $219.22 would open the door to a short-term rally, whereas a drop below $208.97 would likely trigger further selling.
Previously it was reported that Salesforce was under sustained downside pressure as technical signals suggested a tenuous balance between ongoing bearish momentum and the potential for a rebound. The latest developments reaffirm this outlook, with mixed institutional flows and persistent oversold conditions highlighting $208.97 as a pivotal level to watch for a possible directional shift in the coming week.






Latest Salesforce News




-
 Afghanistan
-
 Albania
-
 Algeria
-
 Angola
-
 Argentina
-
 Armenia
-
 Australia
-
 Austria
-
 Azerbaijan
-
 Bahamas
-
 Bahrain
-
 Bangladesh
-
 Belarus
-
 Belgium
-
 Bolivia
-
 Botswana
-
 Brazil
-
 Brunei
-
 Bulgaria
-
 Cambodia
-
 Cameroon
-
 Canada
-
 Chile
-
 China
-
 Colombia
-
 Congo
-
 Costa Rica
-
 Cote d'Ivoire
-
 Croatia
-
 Cuba
-
 Cyprus
-
 Czechia
-
 DR Congo
-
 Denmark
-
 Dominican Republic
-
 Ecuador
-
 Egypt
-
 El Salvador
-
 Estonia
-
 Eswatini
-
 Ethiopia
-
 Finland
-
 France
-
 Georgia
-
 Germany
-
 Ghana
-
 Greece
-
 Haiti
-
 Hong Kong
-
 Hungary
-
 India
-
 Indonesia
-
 Iran, Islamic republic
-
 Iraq
-
 Ireland
-
 Israel
-
 Italy
-
 Jamaica
-
 Japan
-
 Jordan
-
 Kazakhstan
-
 Kenya
-
 Korea
-
 Kuwait
-
 Kyrgyzstan
-
 Laos
-
 Latvia
-
 Lebanon
-
 Lesotho
-
 Libya
-
 Lithuania
-
 Luxembourg
-
 Madagascar
-
 Malaysia
-
 Malta
-
 Mauritius
-
 Mexico
-
 Moldova
-
 Mongolia
-
 Montenegro
-
 Morocco
-
 Mozambique
-
 Myanmar
-
 Namibia
-
 Nepal
-
 Netherlands
-
 New Zealand
-
 Nigeria
-
 North Macedonia
-
 Norway
-
 Oman
-
 Pakistan
-
 Palestine
-
 Panama
-
 Papua New Guinea
-
 Paraguay
-
 Peru
-
 Philippines
-
 Poland
-
 Portugal
-
 Puerto Rico
-
 Qatar
-
 Reunion
-
 Romania
-
 Rwanda
-
 Saudi Arabia
-
 Serbia
-
 Singapore
-
 Slovakia
-
 Slovenia
-
 Somalia
-
 South Africa
-
 Spain
-
 Sri Lanka
-
 Sweden
-
 Switzerland
-
 Syria
-
 Taiwan
-
 Tajikistan
-
 Tanzania
-
 Thailand
-
 Trinidad and Tobago
-
 Tunisia
-
 Turkey
-
 UAE
-
 Uganda
-
 Ukraine
-
 United Kingdom
-
United States
-
 Uruguay
-
 Uzbekistan
-
 Venezuela
-
 Vietnam
-
 Yemen
-
 Zambia
-
 Zimbabwe
- Forex
- Crypto












