

TELUS stock tests C$11.42 support as restructuring and deleveraging plan weighs

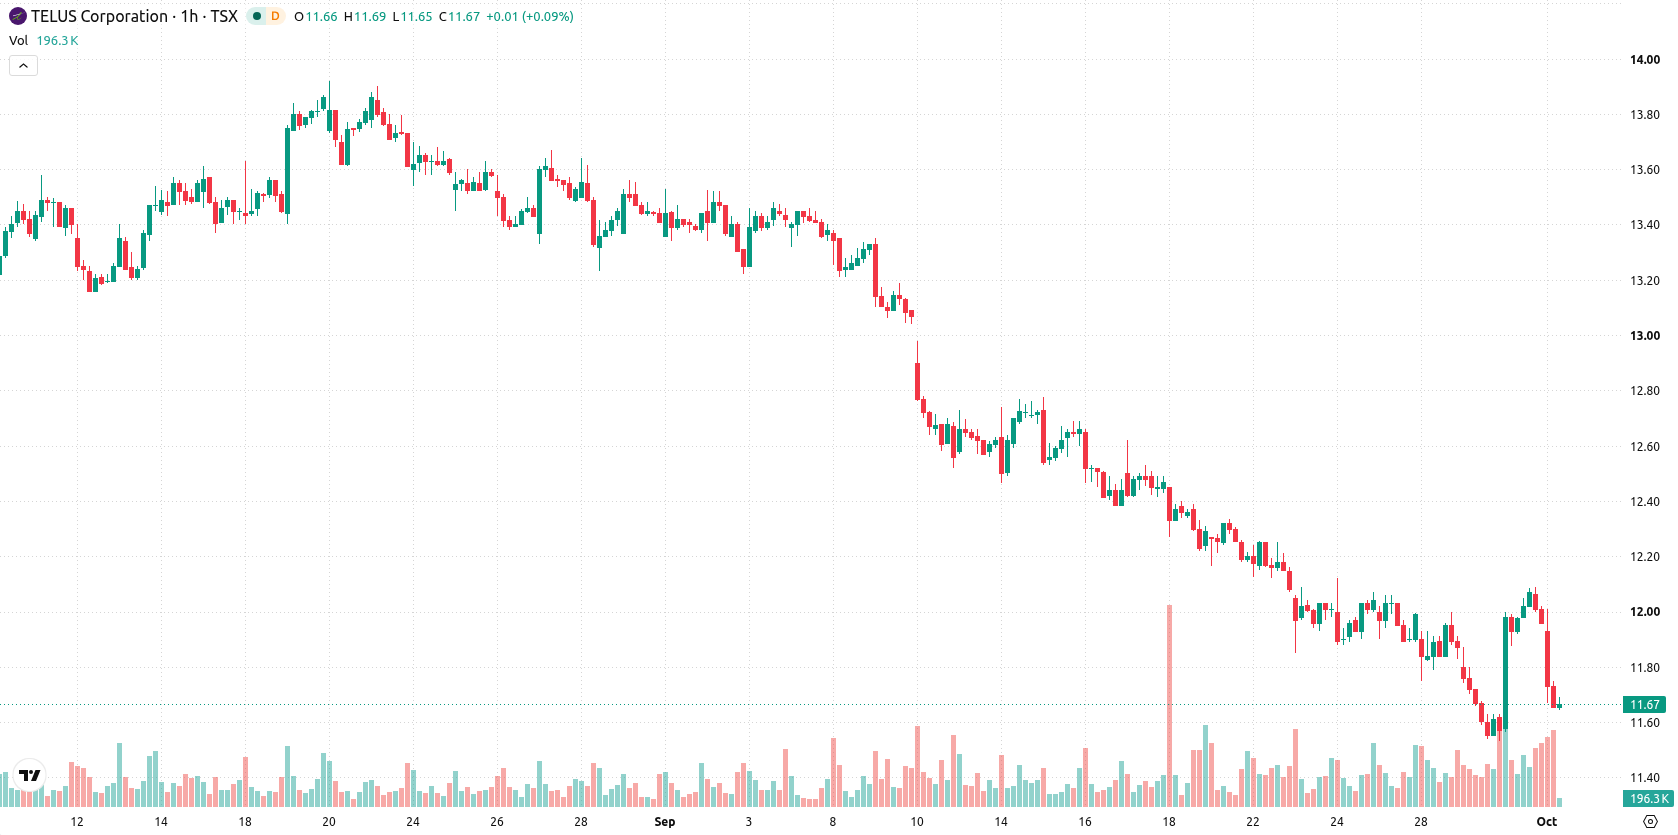
TELUS Corporation (T) stock is trading at C$11.66, down 2.59% on the day with prices lingering near session lows and daily volatility remaining moderate. The stock currently sits below its key moving averages, signaling persistent short-term weakness.
 12.30
12.36
Highlights
- TELUS enacted a 55% dividend cut to C$0.1875 per share in a move to preserve cash.
- Management is reshaping the balance sheet with ongoing restructuring, deleveraging, and investments in AI-driven infrastructure.
- Shares of TELUS trade below key moving averages with a 2.59% daily decline, and the expected range is C$11.42 to C$11.9 with downside risk prevailing.
Dividend cut and AI focus as TELUS prioritizes balance sheet
TELUS has enacted its first reduced dividend payout under its reset structure, lowering the distribution to C$0.1875 per share, a 55% cut that underscores management's shift toward cash preservation, as reported by Investing.com and Finwire. This move suggests a deliberate effort to strengthen the company's balance sheet and adapt to ongoing operational demands, which may temper the stock's yield attractiveness in the near term. Ongoing restructuring, deleveraging, and a strategic focus on AI-driven infrastructure, highlighted by Kalkine, further define the corporate transformation underway, though price action has remained under broader selling pressure.
Intraday buyer interest amid mixed momentum and technical barriers
On the hourly timeframe, T is trading below both the MA-20 at C$11.84 and MA-50 at C$11.95, with the daily MA-200 significantly higher at C$16.41. The Ichimoku Kijun at C$11.81 serves as the closest technical resistance, while support is identified near C$11.42. Momentum indicators are mixed: MACD is Neutral, ADX shows a Sell bias, and Stochastic RSI is also Neutral. However, RSI at 52.83, along with CCI and Bull/Bear Power, point to intraday buyer dominance, and the Awesome Oscillator is positive, highlighting renewed intraday buying interest.
Drift or consolidation likely as downside risk outweighs upside
For the coming days, T is forecast to trade within a typical volatility band between C$11.42 and C$11.9. Model probabilities place downside risk at 75%, with upside potential capped at 25%, making a drift lower or sideways trade more likely than a recovery. The baseline scenario expects consolidation within this corridor; a sustained breakout above C$11.81 would open the way for a bullish move, while a close below C$11.42 could prompt further downside.
Previously it was reported that TELUS faced persistent downside momentum and implemented a sharp dividend cut to reinforce its financial position. The current analysis strengthens that outlook by highlighting ongoing technical weakness and suggests traders focus on a potential shift in trend should the stock decisively move beyond the C$11.81 resistance or below the C$11.42 support in the near term.










-
 Afghanistan
-
 Albania
-
 Algeria
-
 Angola
-
 Argentina
-
 Armenia
-
 Australia
-
 Austria
-
 Azerbaijan
-
 Bahamas
-
 Bahrain
-
 Bangladesh
-
 Belarus
-
 Belgium
-
 Bolivia
-
 Botswana
-
 Brazil
-
 Brunei
-
 Bulgaria
-
 Cambodia
-
 Cameroon
-
 Canada
-
 Chile
-
 China
-
 Colombia
-
 Congo
-
 Costa Rica
-
 Cote d'Ivoire
-
 Croatia
-
 Cuba
-
 Cyprus
-
 Czechia
-
 DR Congo
-
 Denmark
-
 Dominican Republic
-
 Ecuador
-
 Egypt
-
 El Salvador
-
 Estonia
-
 Eswatini
-
 Ethiopia
-
 Finland
-
 France
-
 Georgia
-
 Germany
-
 Ghana
-
 Greece
-
 Haiti
-
 Hong Kong
-
 Hungary
-
 India
-
 Indonesia
-
 Iran, Islamic republic
-
 Iraq
-
 Ireland
-
 Israel
-
 Italy
-
 Jamaica
-
 Japan
-
 Jordan
-
 Kazakhstan
-
 Kenya
-
 Korea
-
 Kuwait
-
 Kyrgyzstan
-
 Laos
-
 Latvia
-
 Lebanon
-
 Lesotho
-
 Libya
-
 Lithuania
-
 Luxembourg
-
 Madagascar
-
 Malaysia
-
 Malta
-
 Mauritius
-
 Mexico
-
 Moldova
-
 Mongolia
-
 Montenegro
-
 Morocco
-
 Mozambique
-
 Myanmar
-
 Namibia
-
 Nepal
-
 Netherlands
-
 New Zealand
-
 Nigeria
-
 North Macedonia
-
 Norway
-
 Oman
-
 Pakistan
-
 Palestine
-
 Panama
-
 Papua New Guinea
-
 Paraguay
-
 Peru
-
 Philippines
-
 Poland
-
 Portugal
-
 Puerto Rico
-
 Qatar
-
 Reunion
-
 Romania
-
 Rwanda
-
 Saudi Arabia
-
 Serbia
-
 Singapore
-
 Slovakia
-
 Slovenia
-
 Somalia
-
 South Africa
-
 Spain
-
 Sri Lanka
-
 Sweden
-
 Switzerland
-
 Syria
-
 Taiwan
-
 Tajikistan
-
 Tanzania
-
 Thailand
-
 Trinidad and Tobago
-
 Tunisia
-
 Turkey
-
 UAE
-
 Uganda
-
 Ukraine
-
 United Kingdom
-
United States
-
 Uruguay
-
 Uzbekistan
-
 Venezuela
-
 Vietnam
-
 Yemen
-
 Zambia
-
 Zimbabwe
- Forex
- Crypto












