

What's behind Tyler Technologies' latest 4.0% stock surge?

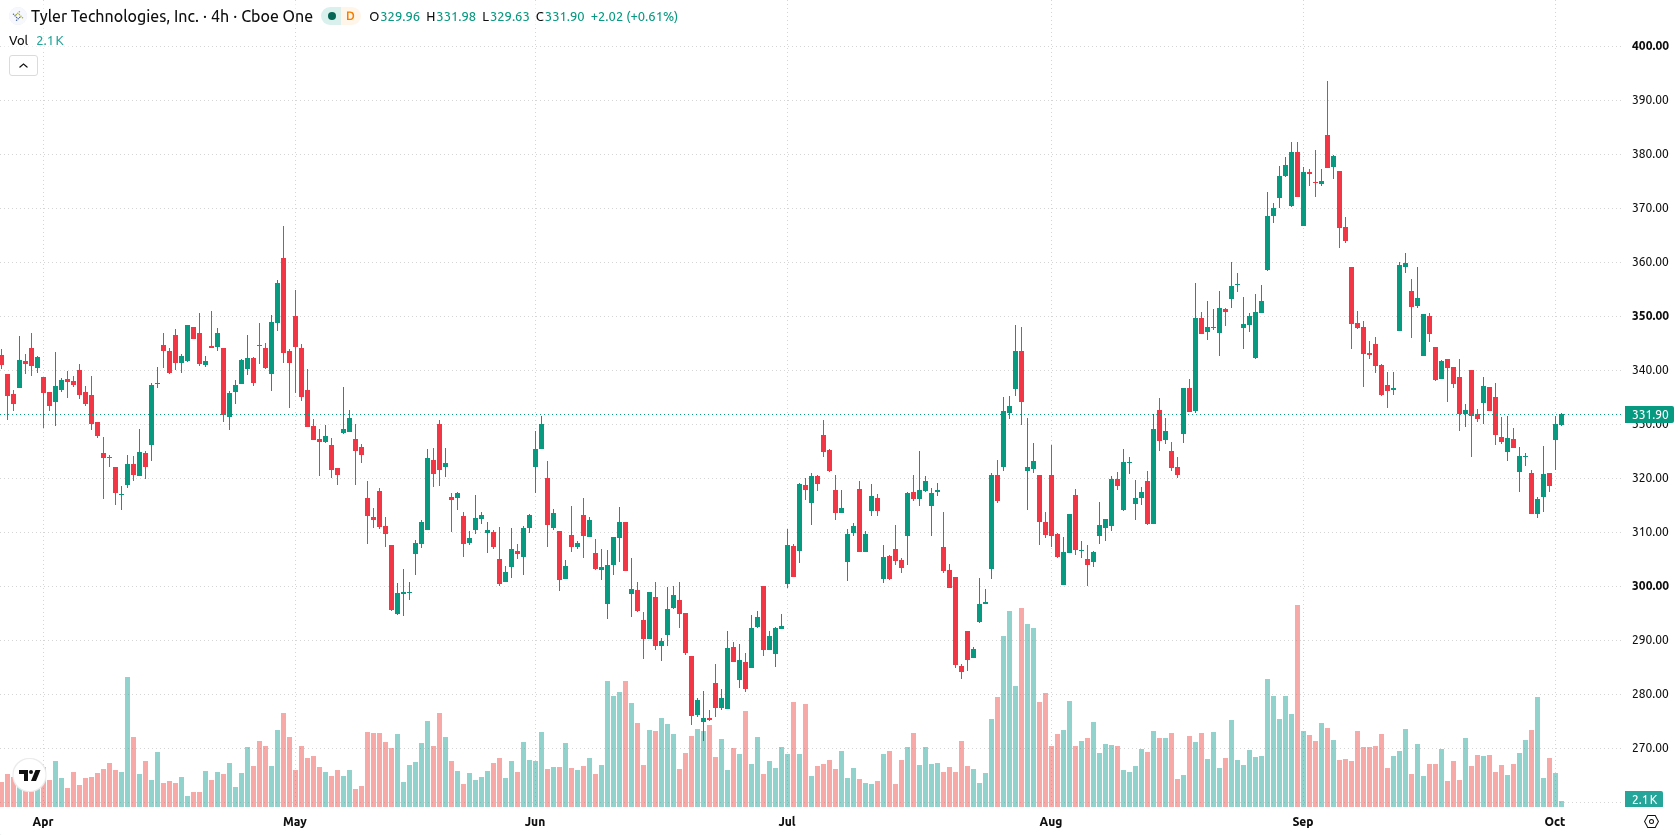
Tyler Technologies, Inc. (TYL) surged 3.99% as technical buying drove a near-term rebound, with the absence of fresh news leaving price action governed by oversold conditions and intraday momentum. The rally looks limited, as TYL remains below the 20-day, 50-day, and 200-day moving averages, signaling sellers retain control across major time frames.
 397.23
Highlights
- Shares of Tyler Technologies trade below key long-term moving averages, indicating ongoing bearish pressure across all time frames.
- Technical indicators show negative momentum with oversold conditions and sellers dominating intraday trading activity.
- Forecasted 5-day range is $321.67 to $341.36, with a 76% probability of a downward move and risk of further decline if support breaks.
Persistent bearish signals as momentum indicators confirm weak trend
TYL is trading below its 20-day ($341.36), 50-day ($334.54), and 200-day ($346.73) moving averages, reinforcing a bearish trend across short-, medium-, and long-term periods. The immediate resistance is at $331.33, while support stands at $321.67. Momentum indicators remain negative: the MACD signals a sell, ADX is neutral indicating a weak trend, and RSI is in the sell zone at 37.97. Stochastic RSI, CCI, and Bull/Bear Power all point to oversold conditions, with BBP’s negative value underscoring the dominance of sellers. The Awesome Oscillator also favors selling pressure. Although TYL gapped up by $6.99 (2.19%) at the open and traded near session highs with 3.13% intraday volatility, underlying momentum remains generally bearish.
Earlier, analysts noted that Tyler Technologies continued to exhibit technical weakness, with sellers maintaining control despite oversold conditions. This latest price rebound reinforces the prevailing bearish bias, making the $331.33 resistance and $321.67 support key levels for traders to monitor for potential breakout or further downside risk.






Latest Tyler Technologies News




-
 Afghanistan
-
 Albania
-
 Algeria
-
 Angola
-
 Argentina
-
 Armenia
-
 Australia
-
 Austria
-
 Azerbaijan
-
 Bahamas
-
 Bahrain
-
 Bangladesh
-
 Belarus
-
 Belgium
-
 Bolivia
-
 Botswana
-
 Brazil
-
 Brunei
-
 Bulgaria
-
 Cambodia
-
 Cameroon
-
 Canada
-
 Chile
-
 China
-
 Colombia
-
 Congo
-
 Costa Rica
-
 Cote d'Ivoire
-
 Croatia
-
 Cuba
-
 Cyprus
-
 Czechia
-
 DR Congo
-
 Denmark
-
 Dominican Republic
-
 Ecuador
-
 Egypt
-
 El Salvador
-
 Estonia
-
 Eswatini
-
 Ethiopia
-
 Finland
-
 France
-
 Georgia
-
 Germany
-
 Ghana
-
 Greece
-
 Haiti
-
 Hong Kong
-
 Hungary
-
 India
-
 Indonesia
-
 Iran, Islamic republic
-
 Iraq
-
 Ireland
-
 Israel
-
 Italy
-
 Jamaica
-
 Japan
-
 Jordan
-
 Kazakhstan
-
 Kenya
-
 Korea
-
 Kuwait
-
 Kyrgyzstan
-
 Laos
-
 Latvia
-
 Lebanon
-
 Lesotho
-
 Libya
-
 Lithuania
-
 Luxembourg
-
 Madagascar
-
 Malaysia
-
 Malta
-
 Mauritius
-
 Mexico
-
 Moldova
-
 Mongolia
-
 Montenegro
-
 Morocco
-
 Mozambique
-
 Myanmar
-
 Namibia
-
 Nepal
-
 Netherlands
-
 New Zealand
-
 Nigeria
-
 North Macedonia
-
 Norway
-
 Oman
-
 Pakistan
-
 Palestine
-
 Panama
-
 Papua New Guinea
-
 Paraguay
-
 Peru
-
 Philippines
-
 Poland
-
 Portugal
-
 Puerto Rico
-
 Qatar
-
 Reunion
-
 Romania
-
 Rwanda
-
 Saudi Arabia
-
 Serbia
-
 Singapore
-
 Slovakia
-
 Slovenia
-
 Somalia
-
 South Africa
-
 Spain
-
 Sri Lanka
-
 Sweden
-
 Switzerland
-
 Syria
-
 Taiwan
-
 Tajikistan
-
 Tanzania
-
 Thailand
-
 Trinidad and Tobago
-
 Tunisia
-
 Turkey
-
 UAE
-
 Uganda
-
 Ukraine
-
 United Kingdom
-
United States
-
 Uruguay
-
 Uzbekistan
-
 Venezuela
-
 Vietnam
-
 Yemen
-
 Zambia
-
 Zimbabwe
- Forex
- Crypto












