

Can full-year 2026 revenue guidance lift ServiceNow stock?

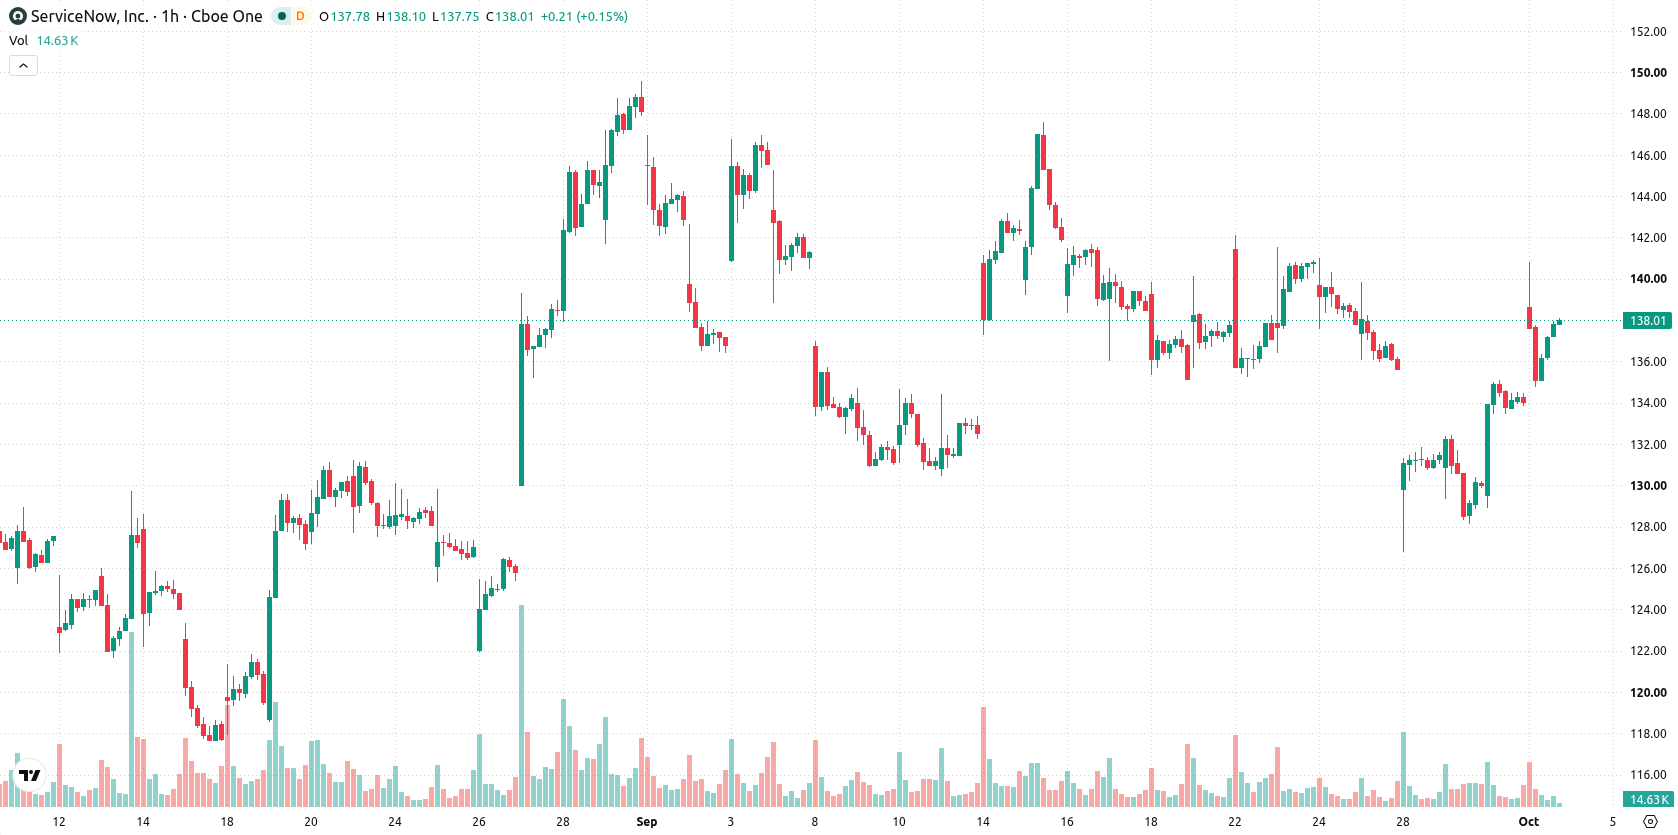
ServiceNow (NOW) stock is trading at $138.31, up 3.21% on the day, following a session marked by strong volatility and a notable gap at the open. The price sits well above its key moving averages, underscoring robust short- and medium-term momentum.
 102.83
104.47
Highlights
- ServiceNow reported Q2 2026 subscription revenue of $3.877 billion, up 24.5% year over year.
- The company raised its full-year 2026 subscription revenue outlook to $15.76 to $15.78 billion and expanded digital workflow offerings with its new AI-native Flow service desk.
- Shares of ServiceNow trade in a strong bullish structure with short-term overbought signals and a projected range of $132.64 to $143.98 for the next 2 to 3 days.
Subscription growth and product launches fuel bullish sentiment
ServiceNow reported Q2 2026 subscription revenue of $3.877 billion, a 24.5% year-over-year increase, demonstrating robust demand for its core platform according to Investing.com. The company has also raised its full-year 2026 subscription revenue outlook to the $15.76–$15.78 billion range, indicating sustained confidence in its recurring business model. In addition, ServiceNow launched Flow, an AI-native service desk that directly integrates IT agents with Slack and Microsoft Teams, as reported by Blockchain.News, expanding its digital workflow offerings and strengthening its competitive position.
Bullish momentum persists as oscillators flag short-term risks
NOW/USD has established strong support at the Ichimoku Kijun on the daily chart at $133.68. Key moving averages on the H1 chart are $132.35 (MA-20) and $135.46 (MA-50), both well below the spot price, with the MA-200 at $116.03 on the daily confirming trend separation. Momentum indicators show RSI at 69.6 and both Stoch RSI and CCI are in overbought territory, while ADX signals continued buying and MACD stands neutral. Bull/Bear Power further underscores intraday buyer dominance, and the Awesome Oscillator supports this bullish momentum, although oscillators highlight elevated short-term risk.
Uptrend likely as technical structure favors upward range break
Looking ahead 2–3 trading days, NOW/USD is expected to trade within the $132.64 to $143.98 band, reflecting typical volatility for the current environment. The likelihood of continued upward movement is estimated at 76%, bolstered by the prevailing technical structure, while the downside scenario has a 24% chance and would require a break and close below immediate support. The base scenario calls for sideways consolidation within the defined range, but a breakout above the upper boundary could trigger accelerated gains, and a clean violation of support would open the door to a corrective pullback.
Previously it was reported that ServiceNow's bullish momentum was supported by robust subscription revenue growth and advances in its AI strategy. The current technical setup, featuring overbought readings and well-defined support at $133.68, now warrants close attention to a potential breakout above $143.98 that could accelerate gains, while a sustained move below support may prompt a deeper short-term correction.






Latest ServiceNow News




-
 Afghanistan
-
 Albania
-
 Algeria
-
 Angola
-
 Argentina
-
 Armenia
-
 Australia
-
 Austria
-
 Azerbaijan
-
 Bahamas
-
 Bahrain
-
 Bangladesh
-
 Belarus
-
 Belgium
-
 Bolivia
-
 Botswana
-
 Brazil
-
 Brunei
-
 Bulgaria
-
 Cambodia
-
 Cameroon
-
 Canada
-
 Chile
-
 China
-
 Colombia
-
 Congo
-
 Costa Rica
-
 Cote d'Ivoire
-
 Croatia
-
 Cuba
-
 Cyprus
-
 Czechia
-
 DR Congo
-
 Denmark
-
 Dominican Republic
-
 Ecuador
-
 Egypt
-
 El Salvador
-
 Estonia
-
 Eswatini
-
 Ethiopia
-
 Finland
-
 France
-
 Georgia
-
 Germany
-
 Ghana
-
 Greece
-
 Haiti
-
 Hong Kong
-
 Hungary
-
 India
-
 Indonesia
-
 Iran, Islamic republic
-
 Iraq
-
 Ireland
-
 Israel
-
 Italy
-
 Jamaica
-
 Japan
-
 Jordan
-
 Kazakhstan
-
 Kenya
-
 Korea
-
 Kuwait
-
 Kyrgyzstan
-
 Laos
-
 Latvia
-
 Lebanon
-
 Lesotho
-
 Libya
-
 Lithuania
-
 Luxembourg
-
 Madagascar
-
 Malaysia
-
 Malta
-
 Mauritius
-
 Mexico
-
 Moldova
-
 Mongolia
-
 Montenegro
-
 Morocco
-
 Mozambique
-
 Myanmar
-
 Namibia
-
 Nepal
-
 Netherlands
-
 New Zealand
-
 Nigeria
-
 North Macedonia
-
 Norway
-
 Oman
-
 Pakistan
-
 Palestine
-
 Panama
-
 Papua New Guinea
-
 Paraguay
-
 Peru
-
 Philippines
-
 Poland
-
 Portugal
-
 Puerto Rico
-
 Qatar
-
 Reunion
-
 Romania
-
 Rwanda
-
 Saudi Arabia
-
 Serbia
-
 Singapore
-
 Slovakia
-
 Slovenia
-
 Somalia
-
 South Africa
-
 Spain
-
 Sri Lanka
-
 Sweden
-
 Switzerland
-
 Syria
-
 Taiwan
-
 Tajikistan
-
 Tanzania
-
 Thailand
-
 Trinidad and Tobago
-
 Tunisia
-
 Turkey
-
 UAE
-
 Uganda
-
 Ukraine
-
 United Kingdom
-
United States
-
 Uruguay
-
 Uzbekistan
-
 Venezuela
-
 Vietnam
-
 Yemen
-
 Zambia
-
 Zimbabwe
- Forex
- Crypto












