

GE Vernova shares technical analysis: Rally targets $1,000 resistance

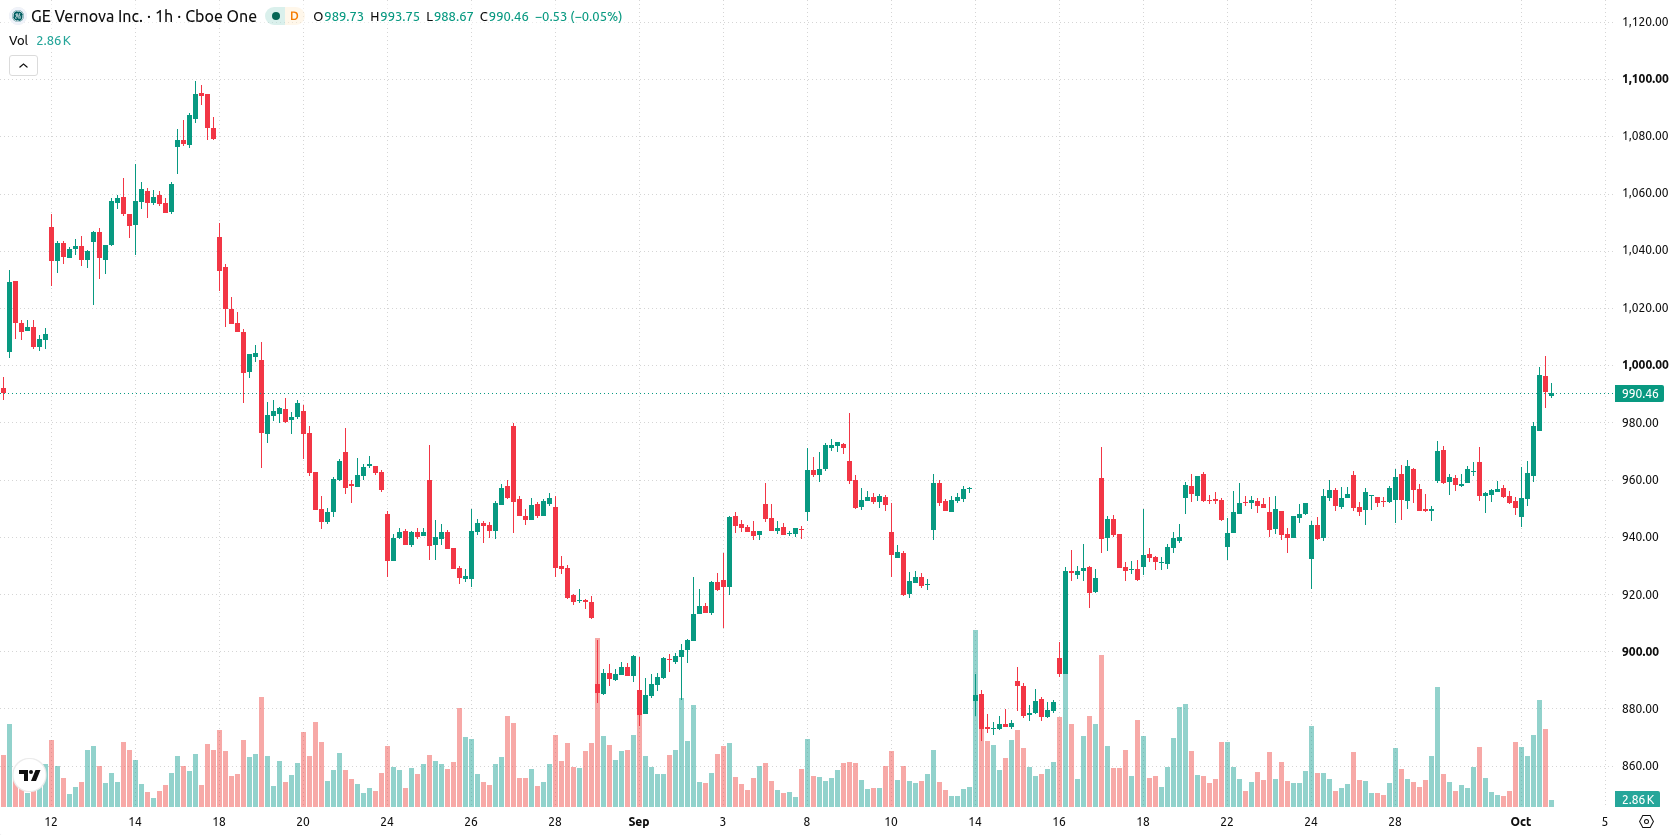
GE Vernova (GEV) stock is trading at $987.52 after rising 3.96% on the day. The price remains above its key moving averages, marking continued strength in the prevailing trend.
 793.71
870.00
Highlights
- GE Vernova's wind segment has reached a profitability pivot, moving out of losses according to CEO Scott Strazik.
- This operational turnaround reduces a previous drag on consolidated results and improves the outlook for company margins.
- Shares trade in a bullish structure on both short and long term timeframes, with expected price range at $974.28 to $1,000 over the next 2 to 3 days and a 79% likelihood of continued upward movement.
Profitability shift in wind segment spurs investor optimism
GE Vernova has reached a key 'profitability pivot point' in its wind segment, as confirmed by CEO Scott Strazik, according to Fool. This transition signals a move out of losses for the previously challenged business line, reducing drag on consolidated financial results and improving the company's outlook. The announcement has contributed to heightened market interest, as investors view the operational turnaround as a catalyst for broader margin growth.
Diverging technical signals as intraday buying meets overbought signs
Technically, $987.52 is positioned above the MA-20 and MA-50 on the working timeframe and well above the MA-200 on the daily chart. The Ichimoku Kijun level at $958.62 represents immediate support. Among momentum indicators, MACD and ADX are neutral, while both RSI and CCI give a sell bias. Stoch RSI indicates oversold conditions, and Bull/Bear Power shows intraday dominance by buyers, highlighting diverging signals within a session marked by strong buying and high volatility.
Bullish momentum contingent on range breakout or support breach
Over the next two to three trading days, the typical volatility band is likely to remain between $974.28 and $1,000, with a 79% probability of continued upward movement. Price consolidation within this range appears most likely. An upside breakout above $1,000 would confirm further bullish momentum, while a move below $974.28 or the Kijun level would trigger a reversal scenario.
Previously it was reported that GE Vernova maintained a bullish technical alignment, supported by strong fundamental growth and a sustained uptrend. The recent confirmation of a profitability pivot in the wind segment strengthens the longer-term outlook, making the $1,000 level a key technical threshold to monitor for a potential continuation of upward momentum.









-
 Afghanistan
-
 Albania
-
 Algeria
-
 Angola
-
 Argentina
-
 Armenia
-
 Australia
-
 Austria
-
 Azerbaijan
-
 Bahamas
-
 Bahrain
-
 Bangladesh
-
 Belarus
-
 Belgium
-
 Bolivia
-
 Botswana
-
 Brazil
-
 Brunei
-
 Bulgaria
-
 Cambodia
-
 Cameroon
-
 Canada
-
 Chile
-
 China
-
 Colombia
-
 Congo
-
 Costa Rica
-
 Cote d'Ivoire
-
 Croatia
-
 Cuba
-
 Cyprus
-
 Czechia
-
 DR Congo
-
 Denmark
-
 Dominican Republic
-
 Ecuador
-
 Egypt
-
 El Salvador
-
 Estonia
-
 Eswatini
-
 Ethiopia
-
 Finland
-
 France
-
 Georgia
-
 Germany
-
 Ghana
-
 Greece
-
 Haiti
-
 Hong Kong
-
 Hungary
-
 India
-
 Indonesia
-
 Iran, Islamic republic
-
 Iraq
-
 Ireland
-
 Israel
-
 Italy
-
 Jamaica
-
 Japan
-
 Jordan
-
 Kazakhstan
-
 Kenya
-
 Korea
-
 Kuwait
-
 Kyrgyzstan
-
 Laos
-
 Latvia
-
 Lebanon
-
 Lesotho
-
 Libya
-
 Lithuania
-
 Luxembourg
-
 Madagascar
-
 Malaysia
-
 Malta
-
 Mauritius
-
 Mexico
-
 Moldova
-
 Mongolia
-
 Montenegro
-
 Morocco
-
 Mozambique
-
 Myanmar
-
 Namibia
-
 Nepal
-
 Netherlands
-
 New Zealand
-
 Nigeria
-
 North Macedonia
-
 Norway
-
 Oman
-
 Pakistan
-
 Palestine
-
 Panama
-
 Papua New Guinea
-
 Paraguay
-
 Peru
-
 Philippines
-
 Poland
-
 Portugal
-
 Puerto Rico
-
 Qatar
-
 Reunion
-
 Romania
-
 Rwanda
-
 Saudi Arabia
-
 Serbia
-
 Singapore
-
 Slovakia
-
 Slovenia
-
 Somalia
-
 South Africa
-
 Spain
-
 Sri Lanka
-
 Sweden
-
 Switzerland
-
 Syria
-
 Taiwan
-
 Tajikistan
-
 Tanzania
-
 Thailand
-
 Trinidad and Tobago
-
 Tunisia
-
 Turkey
-
 UAE
-
 Uganda
-
 Ukraine
-
 United Kingdom
-
United States
-
 Uruguay
-
 Uzbekistan
-
 Venezuela
-
 Vietnam
-
 Yemen
-
 Zambia
-
 Zimbabwe
- Forex
- Crypto












