

Will Hut 8 stock hold $79.42 support as weak momentum persists?

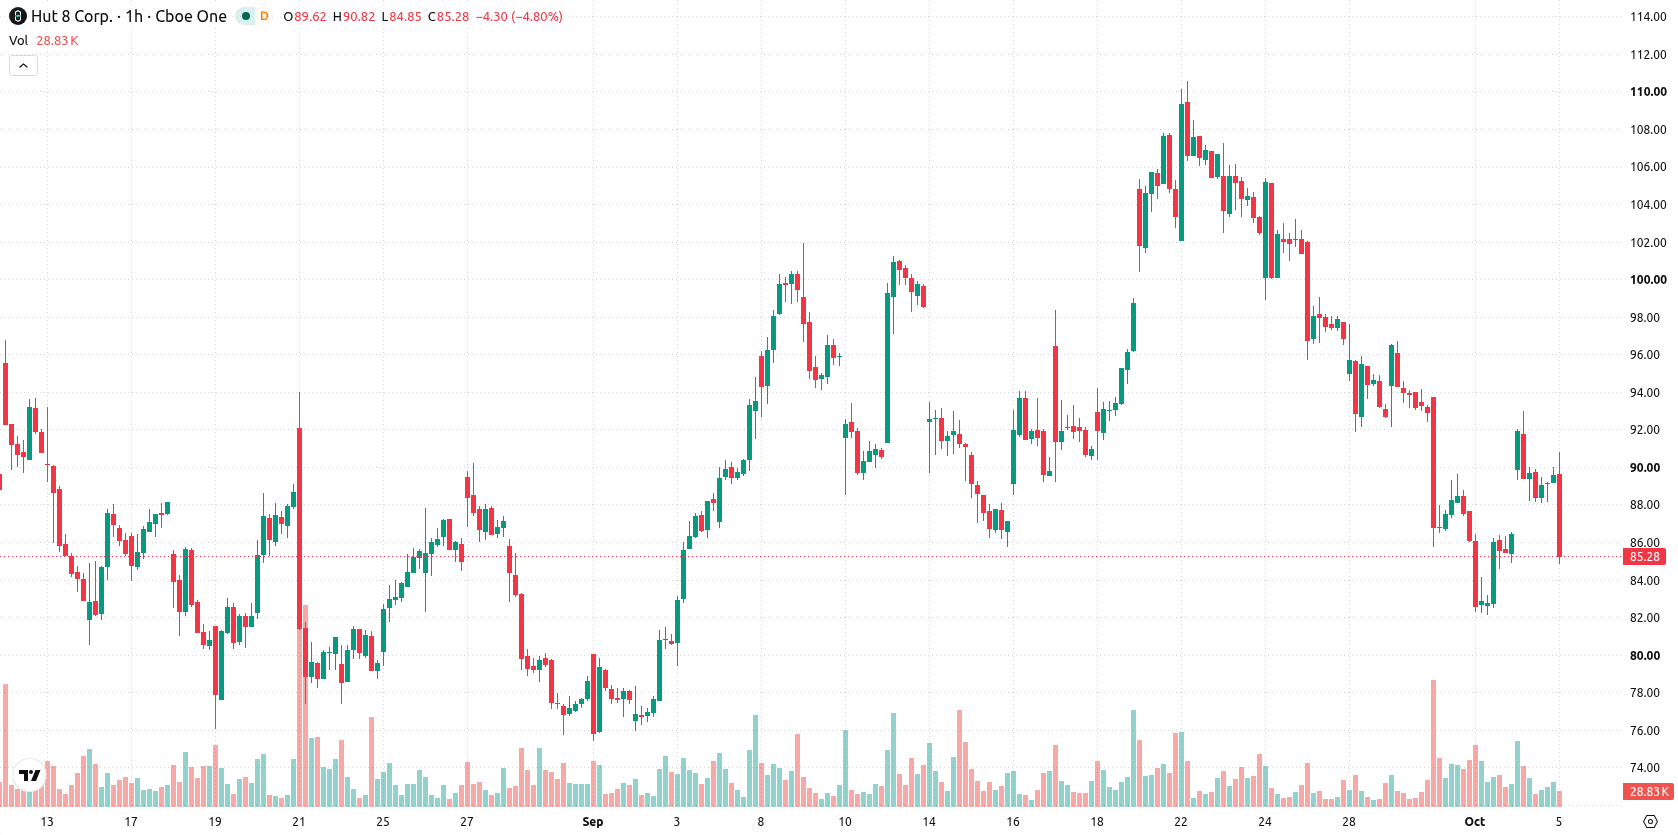
Hut 8 (HUT) stock is trading at $85.91, down 4.17% on the day. The price sits below key short- and medium-term moving averages while remaining above longer-term trend levels.
 58.31
57.21
Highlights
- HUT/USD trades below short- and medium-term moving averages but holds above its 200-day, indicating ongoing seller pressure.
- Momentum indicators are mixed, with MACD and ADX showing selling pressure while oscillators register overbought intraday conditions.
- Expected short-term price range is $79.42 to $92.4 with a 57% probability of a downward move.
Momentum divergence signals downside uncertainty amid mixed indicators
HUT is trading below the MA-20 at $87.16 and the MA-50 at $92.94, signaling ongoing short- and medium-term downward pressure. The current price holds above the MA-200 at $80.25, while the daily Ichimoku Kijun level at $88.34 now acts as immediate resistance. Momentum indicators are mixed: MACD and ADX both show strong selling pressure, whereas RSI and CCI are in buy territory. Stochastic RSI and Bull/Bear Power appear overbought, reflecting active intraday buying, but the Awesome Oscillator points to further downside risks. This divergence creates notable uncertainty, with intraday weakness better reflected in the MACD and ADX direction than in bullish oscillator readings.
Consolidation favored as bearish momentum tempers rebound odds
Over the next several sessions, HUT is expected to trade within a typical volatility band between $79.42 and $92.4. There is a 43% probability of an upward move, but the down scenario remains more likely with a 57% probability. The baseline scenario envisions the price consolidating within this corridor; a break above $88.34 could open a test of higher resistance, while a bearish scenario emerges if HUT trades below $79.42, potentially accelerating downside momentum.
Earlier, analysts noted that Hut 8 faced ongoing technical headwinds with downside risks persisting due to mixed momentum signals and weak operational trends. The present analysis further reinforces this cautious outlook, highlighting that any sustained move will likely depend on price action relative to the immediate $88.34 resistance as volatility is expected to persist within the established range.











-
 Afghanistan
-
 Albania
-
 Algeria
-
 Angola
-
 Argentina
-
 Armenia
-
 Australia
-
 Austria
-
 Azerbaijan
-
 Bahamas
-
 Bahrain
-
 Bangladesh
-
 Belarus
-
 Belgium
-
 Bolivia
-
 Botswana
-
 Brazil
-
 Brunei
-
 Bulgaria
-
 Cambodia
-
 Cameroon
-
 Canada
-
 Chile
-
 China
-
 Colombia
-
 Congo
-
 Costa Rica
-
 Cote d'Ivoire
-
 Croatia
-
 Cuba
-
 Cyprus
-
 Czechia
-
 DR Congo
-
 Denmark
-
 Dominican Republic
-
 Ecuador
-
 Egypt
-
 El Salvador
-
 Estonia
-
 Eswatini
-
 Ethiopia
-
 Finland
-
 France
-
 Georgia
-
 Germany
-
 Ghana
-
 Greece
-
 Haiti
-
 Hong Kong
-
 Hungary
-
 India
-
 Indonesia
-
 Iran, Islamic republic
-
 Iraq
-
 Ireland
-
 Israel
-
 Italy
-
 Jamaica
-
 Japan
-
 Jordan
-
 Kazakhstan
-
 Kenya
-
 Korea
-
 Kuwait
-
 Kyrgyzstan
-
 Laos
-
 Latvia
-
 Lebanon
-
 Lesotho
-
 Libya
-
 Lithuania
-
 Luxembourg
-
 Madagascar
-
 Malaysia
-
 Malta
-
 Mauritius
-
 Mexico
-
 Moldova
-
 Mongolia
-
 Montenegro
-
 Morocco
-
 Mozambique
-
 Myanmar
-
 Namibia
-
 Nepal
-
 Netherlands
-
 New Zealand
-
 Nigeria
-
 North Macedonia
-
 Norway
-
 Oman
-
 Pakistan
-
 Palestine
-
 Panama
-
 Papua New Guinea
-
 Paraguay
-
 Peru
-
 Philippines
-
 Poland
-
 Portugal
-
 Puerto Rico
-
 Qatar
-
 Reunion
-
 Romania
-
 Rwanda
-
 Saudi Arabia
-
 Serbia
-
 Singapore
-
 Slovakia
-
 Slovenia
-
 Somalia
-
 South Africa
-
 Spain
-
 Sri Lanka
-
 Sweden
-
 Switzerland
-
 Syria
-
 Taiwan
-
 Tajikistan
-
 Tanzania
-
 Thailand
-
 Trinidad and Tobago
-
 Tunisia
-
 Turkey
-
 UAE
-
 Uganda
-
 Ukraine
-
 United Kingdom
-
United States
-
 Uruguay
-
 Uzbekistan
-
 Venezuela
-
 Vietnam
-
 Yemen
-
 Zambia
-
 Zimbabwe
- Forex
- Crypto












