

Enbridge shares technical analysis: Consolidation near C$64.85 support

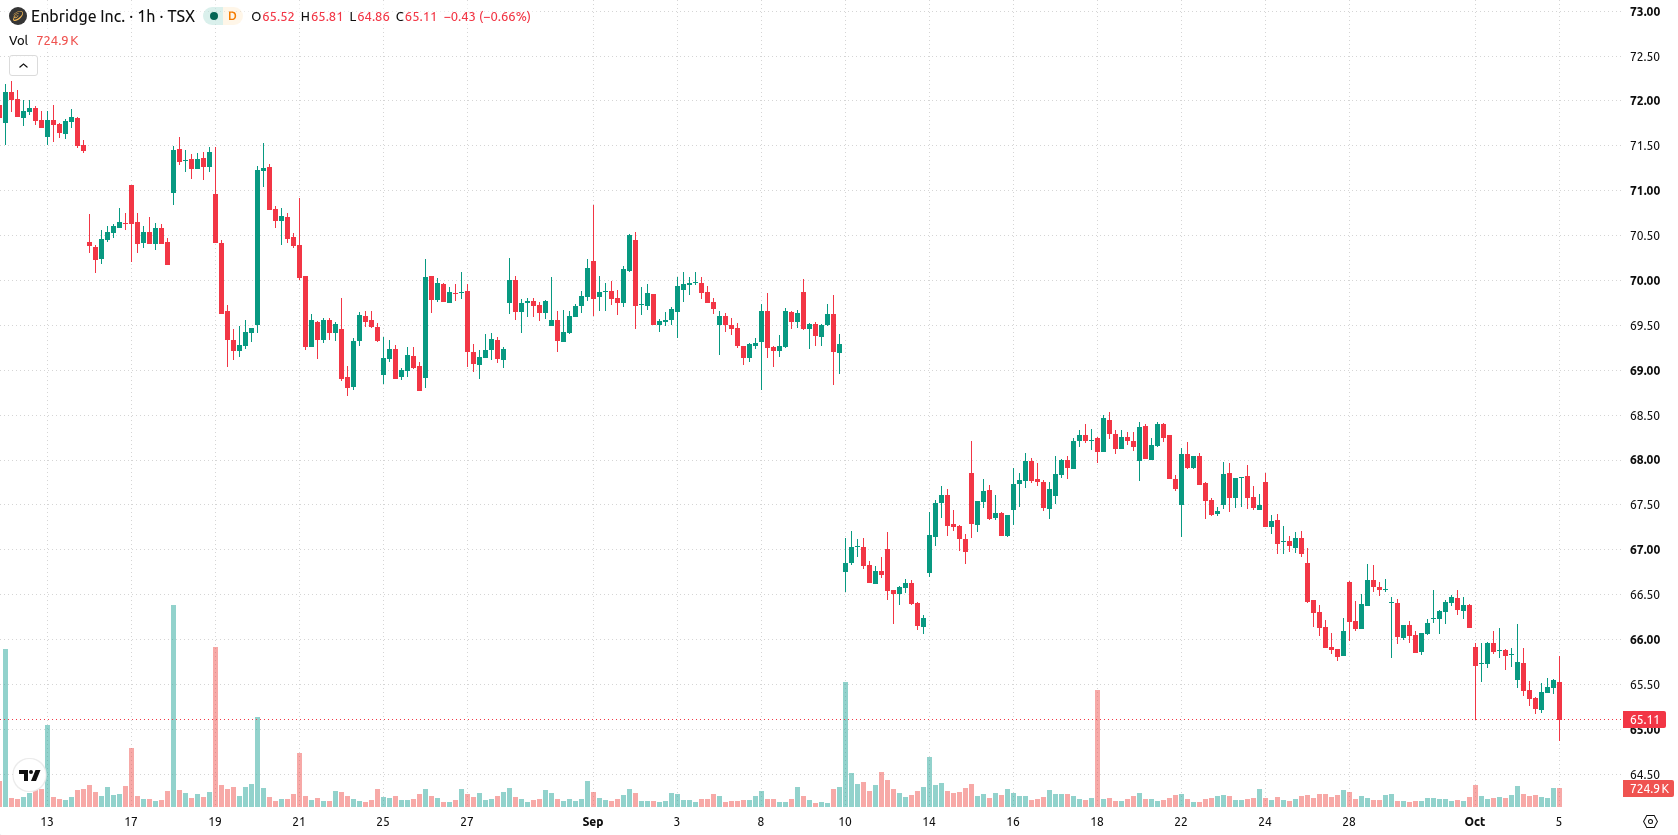
Enbridge Inc. (ENB) stock is trading at C$65.46 after a marginal move lower on the day. The price remains below its key moving averages, suggesting a continuation of the short-term downside trend.
 68.32
69.33
Highlights
- Enbridge has entered a joint venture with KKR and Apollo for C$2.7 billion Westcoast natural gas pipeline expansions in British Columbia.
- Enbridge gains C$700 million cash upfront, retains majority ownership and operational control, with a buyback option from year seven to fourteen.
- Shares of Enbridge trade below key moving averages, with technical indicators showing strong selling pressure and high downside probability in the C$64.85 to C$66.07 range.
Liquidity boost and long-term flexibility as joint venture secures pipeline funding
Enbridge has entered into a joint venture with KKR and Apollo to support C$2.7 billion in expansions of its Westcoast natural gas pipeline system in British Columbia, according to Energynow. Under the agreement, KKR and Apollo will fund two major projects—Aspen Point and Sunrise—while Enbridge receives an immediate C$700 million cash payment at closing, ensuring enhanced liquidity for its ongoing operations. The company retains majority ownership and operational control of the pipeline, with a structured option to repurchase the investors' interest between the seventh and fourteenth year after closing, which adds significant long-term strategic flexibility.
Persistent selling pressure and diminished momentum as key indicators signal
On the technical front, ENB is trading below its MA-20 (C$65.81) and MA-50 (C$66.18) on the h1 chart and well under the long-term MA-200 (C$72.27, D1). Immediate resistance aligns with the Ichimoku Kijun at C$65.82. Supporting levels are found at C$64.85, with resistance at C$66.07. Indicator-wise, RSI stands low at 38.34, while MACD, ADX, CCI, and Bull/Bear Power all register sell signals, reflecting ongoing selling pressure in intraday trading. Both Stoch RSI and Awesome Oscillator are currently neutral, signaling some loss of downside momentum.
Limited rebound prospects as price action remains capped by resistance
Over the next several sessions, ENB is likely to trade in a range between C$64.85 and C$66.07, consistent with typical volatility bands for this name. The probability of a sustained upward move is low, whereas further downside remains the dominant short-term scenario; a reversal higher would require a decisive break above the C$65.82 resistance. A move below the C$64.85 support would increase downside risk and open the way for further losses, while a base case outcome is continued sideways trading within this defined band.
Earlier, analysts noted that Enbridge’s technical outlook remained weak despite ongoing operational improvements and infrastructure expansion. The current analysis reinforces this view, with renewed joint venture activity and additional liquidity providing longer-term flexibility, but the immediate priority for traders remains monitoring the C$65.82 resistance and C$64.85 support for signs of a directional breakout.






Latest Enbridge News





-
 Afghanistan
-
 Albania
-
 Algeria
-
 Angola
-
 Argentina
-
 Armenia
-
 Australia
-
 Austria
-
 Azerbaijan
-
 Bahamas
-
 Bahrain
-
 Bangladesh
-
 Belarus
-
 Belgium
-
 Bolivia
-
 Botswana
-
 Brazil
-
 Brunei
-
 Bulgaria
-
 Cambodia
-
 Cameroon
-
 Canada
-
 Chile
-
 China
-
 Colombia
-
 Congo
-
 Costa Rica
-
 Cote d'Ivoire
-
 Croatia
-
 Cuba
-
 Cyprus
-
 Czechia
-
 DR Congo
-
 Denmark
-
 Dominican Republic
-
 Ecuador
-
 Egypt
-
 El Salvador
-
 Estonia
-
 Eswatini
-
 Ethiopia
-
 Finland
-
 France
-
 Georgia
-
 Germany
-
 Ghana
-
 Greece
-
 Haiti
-
 Hong Kong
-
 Hungary
-
 India
-
 Indonesia
-
 Iran, Islamic republic
-
 Iraq
-
 Ireland
-
 Israel
-
 Italy
-
 Jamaica
-
 Japan
-
 Jordan
-
 Kazakhstan
-
 Kenya
-
 Korea
-
 Kuwait
-
 Kyrgyzstan
-
 Laos
-
 Latvia
-
 Lebanon
-
 Lesotho
-
 Libya
-
 Lithuania
-
 Luxembourg
-
 Madagascar
-
 Malaysia
-
 Malta
-
 Mauritius
-
 Mexico
-
 Moldova
-
 Mongolia
-
 Montenegro
-
 Morocco
-
 Mozambique
-
 Myanmar
-
 Namibia
-
 Nepal
-
 Netherlands
-
 New Zealand
-
 Nigeria
-
 North Macedonia
-
 Norway
-
 Oman
-
 Pakistan
-
 Palestine
-
 Panama
-
 Papua New Guinea
-
 Paraguay
-
 Peru
-
 Philippines
-
 Poland
-
 Portugal
-
 Puerto Rico
-
 Qatar
-
 Reunion
-
 Romania
-
 Rwanda
-
 Saudi Arabia
-
 Serbia
-
 Singapore
-
 Slovakia
-
 Slovenia
-
 Somalia
-
 South Africa
-
 Spain
-
 Sri Lanka
-
 Sweden
-
 Switzerland
-
 Syria
-
 Taiwan
-
 Tajikistan
-
 Tanzania
-
 Thailand
-
 Trinidad and Tobago
-
 Tunisia
-
 Turkey
-
 UAE
-
 Uganda
-
 Ukraine
-
 United Kingdom
-
United States
-
 Uruguay
-
 Uzbekistan
-
 Venezuela
-
 Vietnam
-
 Yemen
-
 Zambia
-
 Zimbabwe
- Forex
- Crypto












