

Fair Isaac shares gain almost 3% after deep oversold signals draw short-term buyers

Fair Isaac Corporation (FICO) climbed 2.97% in a technical rebound, with oversold conditions drawing short-term buyers despite the absence of fresh company news. The move looks limited, as the stock remains deeply below all major moving averages and upside momentum faces strong resistance.
 716.00
780.56
Highlights
- Shares of Fair Isaac trade well below key moving averages, confirming broad downward pressure across short and long timeframes.
- Momentum signals indicate ongoing selling pressure, with most major indicators forecasting a bearish trend and oversold conditions.
- Over the next five days, Fair Isaac stock is expected to remain range-bound from $635.43 to $726.65, with a high probability of further declines.
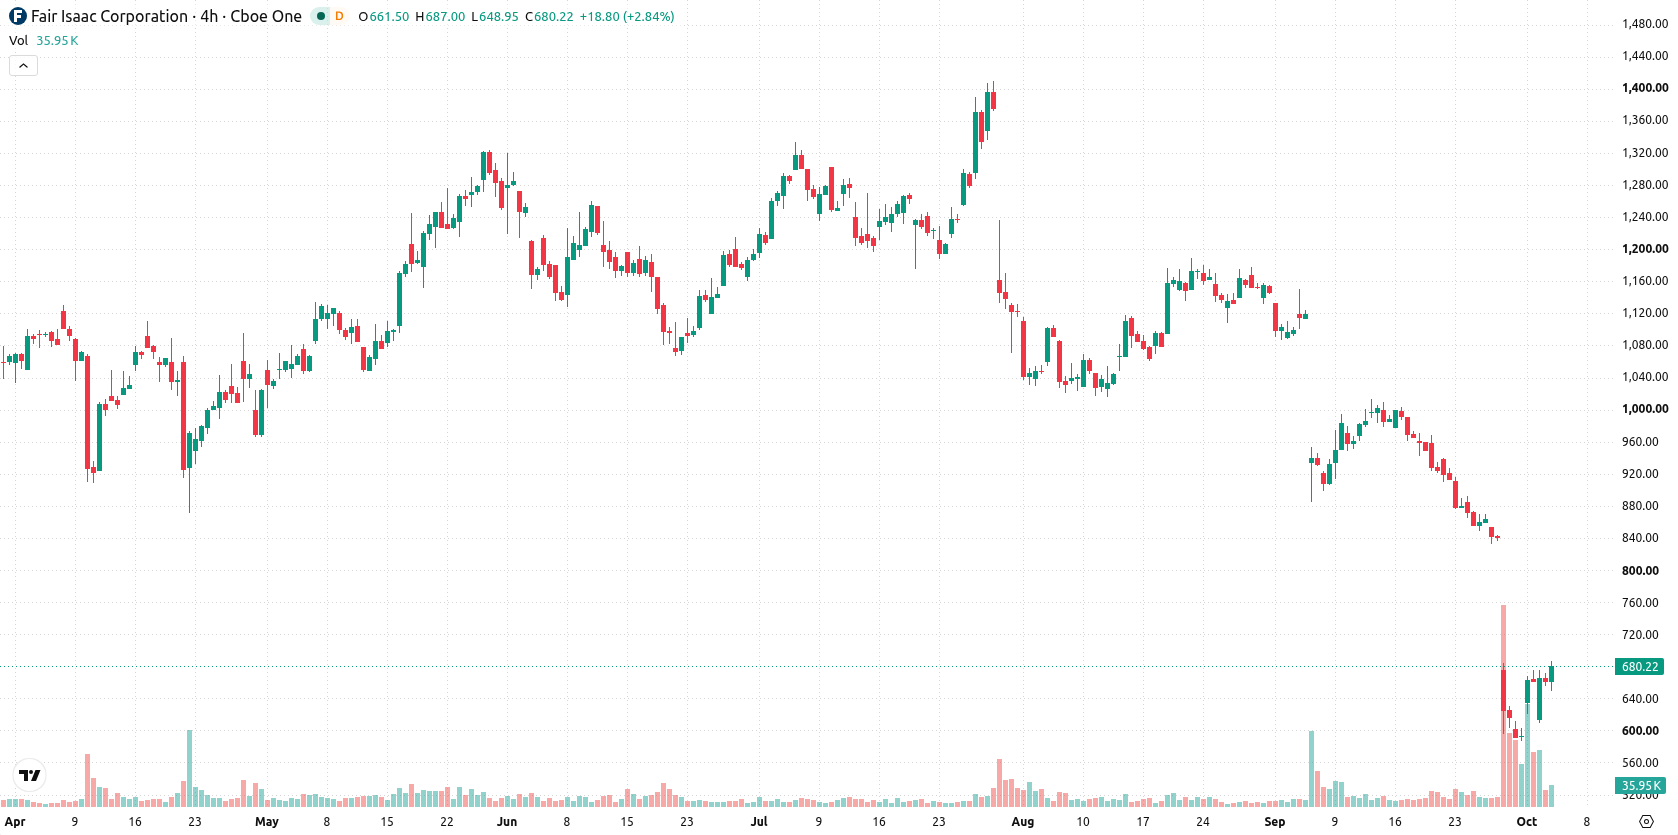
Sustained downside pressure as technical weakness intensifies
Fair Isaac is trading well below its 20-day, 50-day, and 200-day moving averages ($874.98, $1,028, and $1,218 respectively), which signals strong selling pressure across all time frames. Immediate levels to monitor are the near-term resistance at $683.97 and support at $677.67, with medium- to long-term bearish alignment evidenced by the 50-day remaining below the 200-day moving average. Technical indicators show persistent weakness: the MACD and ADX are both in sell mode, the RSI is deeply oversold at 26.19, and the CCI also points to oversold conditions. Bull/Bear Power remains negative at -116.89 and forecasts further selling, while the Awesome Oscillator maintains its negative trend. The session began with a narrow upside gap and the stock is trading near its session high at $681.04, up $19.62 or 2.97%. Intraday volatility is elevated at 5.40%. Although there is intraday strength toward session highs, the broad indicator set supports continued downside pressure.
Earlier, analysts noted that Fair Isaac's loss of its government mortgage scoring monopoly raised significant downside risks, with persistent bearish technical signals dominating the outlook. The current rebound does little to alter the prevailing scenario, and traders should monitor $683.97 as a near-term resistance whose rejection could reinforce the case for continued downside movement within the projected volatility band.






Latest Fair Isaac Corporation News




-
 Afghanistan
-
 Albania
-
 Algeria
-
 Angola
-
 Argentina
-
 Armenia
-
 Australia
-
 Austria
-
 Azerbaijan
-
 Bahamas
-
 Bahrain
-
 Bangladesh
-
 Belarus
-
 Belgium
-
 Bolivia
-
 Botswana
-
 Brazil
-
 Brunei
-
 Bulgaria
-
 Cambodia
-
 Cameroon
-
 Canada
-
 Chile
-
 China
-
 Colombia
-
 Congo
-
 Costa Rica
-
 Cote d'Ivoire
-
 Croatia
-
 Cuba
-
 Cyprus
-
 Czechia
-
 DR Congo
-
 Denmark
-
 Dominican Republic
-
 Ecuador
-
 Egypt
-
 El Salvador
-
 Estonia
-
 Eswatini
-
 Ethiopia
-
 Finland
-
 France
-
 Georgia
-
 Germany
-
 Ghana
-
 Greece
-
 Haiti
-
 Hong Kong
-
 Hungary
-
 India
-
 Indonesia
-
 Iran, Islamic republic
-
 Iraq
-
 Ireland
-
 Israel
-
 Italy
-
 Jamaica
-
 Japan
-
 Jordan
-
 Kazakhstan
-
 Kenya
-
 Korea
-
 Kuwait
-
 Kyrgyzstan
-
 Laos
-
 Latvia
-
 Lebanon
-
 Lesotho
-
 Libya
-
 Lithuania
-
 Luxembourg
-
 Madagascar
-
 Malaysia
-
 Malta
-
 Mauritius
-
 Mexico
-
 Moldova
-
 Mongolia
-
 Montenegro
-
 Morocco
-
 Mozambique
-
 Myanmar
-
 Namibia
-
 Nepal
-
 Netherlands
-
 New Zealand
-
 Nigeria
-
 North Macedonia
-
 Norway
-
 Oman
-
 Pakistan
-
 Palestine
-
 Panama
-
 Papua New Guinea
-
 Paraguay
-
 Peru
-
 Philippines
-
 Poland
-
 Portugal
-
 Puerto Rico
-
 Qatar
-
 Reunion
-
 Romania
-
 Rwanda
-
 Saudi Arabia
-
 Serbia
-
 Singapore
-
 Slovakia
-
 Slovenia
-
 Somalia
-
 South Africa
-
 Spain
-
 Sri Lanka
-
 Sweden
-
 Switzerland
-
 Syria
-
 Taiwan
-
 Tajikistan
-
 Tanzania
-
 Thailand
-
 Trinidad and Tobago
-
 Tunisia
-
 Turkey
-
 UAE
-
 Uganda
-
 Ukraine
-
 United Kingdom
-
United States
-
 Uruguay
-
 Uzbekistan
-
 Venezuela
-
 Vietnam
-
 Yemen
-
 Zambia
-
 Zimbabwe
- Forex
- Crypto












