


LPL Financial Holdings (LPLA) advanced 5.06% as near-term technical support helped trigger buying interest. The move looks limited, with LPLA capped below the 50-day moving average and momentum signals showing persistent weakness.
 303.71
315.78
Highlights
- LPL Financial supports a large network of independent financial advisors with a current market capitalization of about $24.92 billion.
- Recent portfolio changes by 15 institutional investors show ongoing active interest in LPL Financial stock.
- Shares of LPL Financial trade near the session high but face mixed technical signals, with weak momentum and a projected range of $324.94 to $340.46 over five days.
Institutional activity rises as portfolio shifts signal ongoing confidence
LPL Financial serves a substantial network of independent financial advisors, providing compliance and technology support and holding a market capitalization of approximately $24.92 billion. Recent portfolio adjustments by 15 investment gurus continue to indicate active institutional interest in the company.
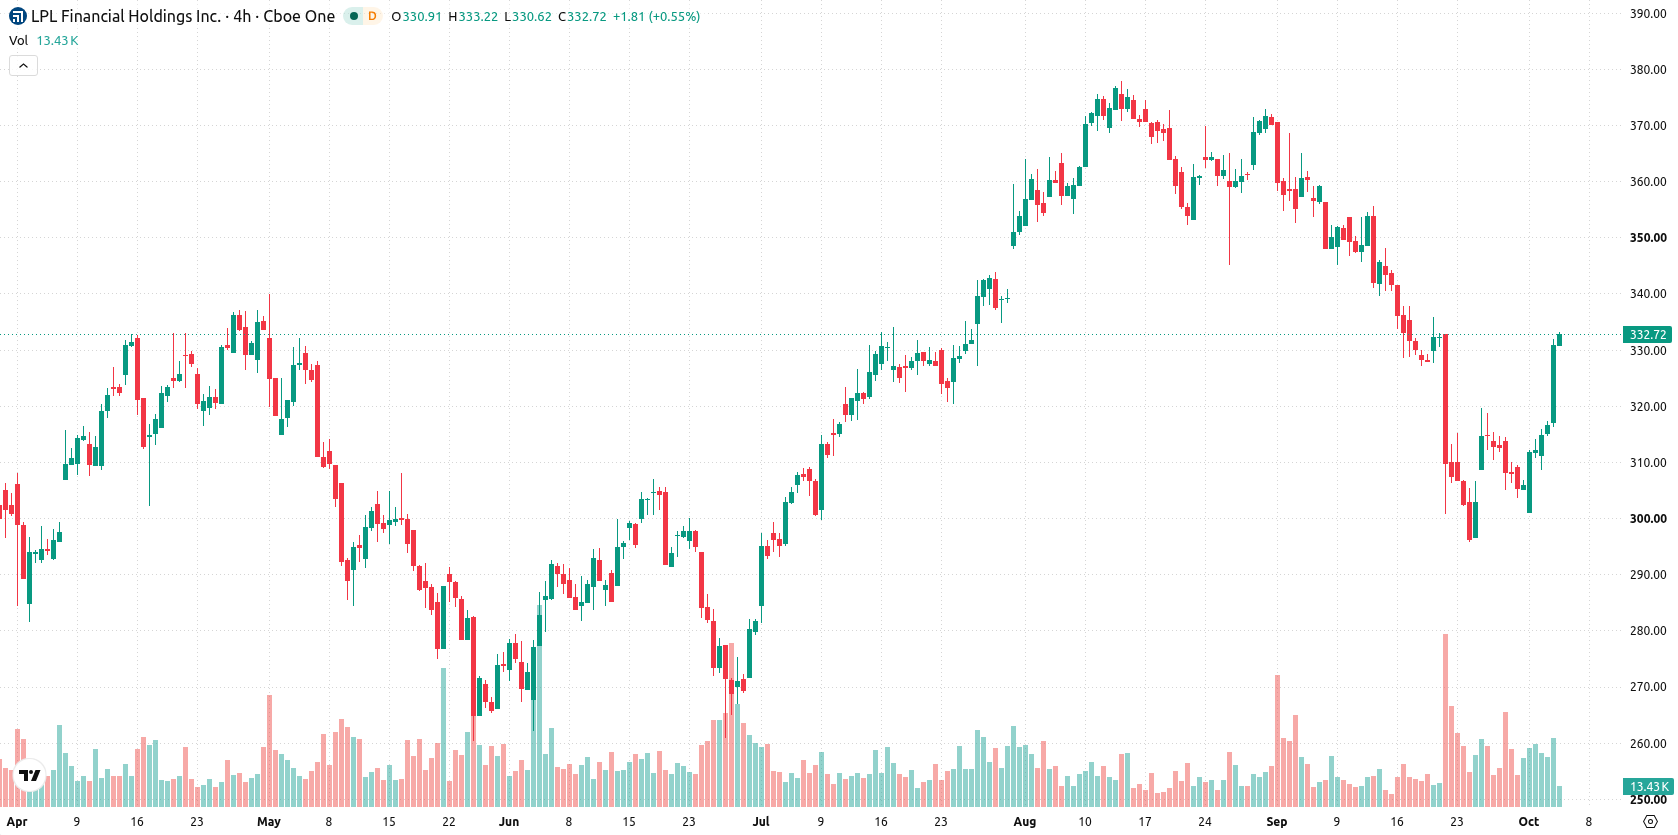
Upward trade meets resistance as bullish structure diverges from weak momentum
LPLA trades above its 20-day ($327.65) and 200-day ($327.36) moving averages but remains below the 50-day moving average ($346.39), demonstrating short-term upward strength amid medium-term resistance and a longer-term bullish structure. The nearest recognized resistance is the Ichimoku Kijun at $334.27, with immediate support found at $332.58, today’s session high. Momentum signals stay weak: both MACD and ADX point to bearish momentum. The RSI remains at 40.9 with a sell bias, while the Stochastic RSI is overbought at 100. The CCI remains in negative territory. Bull/Bear Power at -0.9 signals sellers are in control intraday and flags an oversold state, and the Awesome Oscillator provides no confirmation for the move. The stock is trading near today’s high after an upside gap of $2.71 (0.86%), with intraday volatility at 5.26%. There is a visible divergence as price strength contrasts with soft underlying momentum.
Previously it was reported that LPL Financial remained under sustained bearish pressure despite a short-term bounce, with technical indicators suggesting continued downside risk. The current technical picture supports this cautious outlook, as ongoing weak momentum signals and a high probability of downside movement highlight $332.58 as the critical support level to watch in the coming sessions.






Latest LPL Financial Holdings News




-
 Afghanistan
-
 Albania
-
 Algeria
-
 Angola
-
 Argentina
-
 Armenia
-
 Australia
-
 Austria
-
 Azerbaijan
-
 Bahamas
-
 Bahrain
-
 Bangladesh
-
 Belarus
-
 Belgium
-
 Bolivia
-
 Botswana
-
 Brazil
-
 Brunei
-
 Bulgaria
-
 Cambodia
-
 Cameroon
-
 Canada
-
 Chile
-
 China
-
 Colombia
-
 Congo
-
 Costa Rica
-
 Cote d'Ivoire
-
 Croatia
-
 Cuba
-
 Cyprus
-
 Czechia
-
 DR Congo
-
 Denmark
-
 Dominican Republic
-
 Ecuador
-
 Egypt
-
 El Salvador
-
 Estonia
-
 Eswatini
-
 Ethiopia
-
 Finland
-
 France
-
 Georgia
-
 Germany
-
 Ghana
-
 Greece
-
 Haiti
-
 Hong Kong
-
 Hungary
-
 India
-
 Indonesia
-
 Iran, Islamic republic
-
 Iraq
-
 Ireland
-
 Israel
-
 Italy
-
 Jamaica
-
 Japan
-
 Jordan
-
 Kazakhstan
-
 Kenya
-
 Korea
-
 Kuwait
-
 Kyrgyzstan
-
 Laos
-
 Latvia
-
 Lebanon
-
 Lesotho
-
 Libya
-
 Lithuania
-
 Luxembourg
-
 Madagascar
-
 Malaysia
-
 Malta
-
 Mauritius
-
 Mexico
-
 Moldova
-
 Mongolia
-
 Montenegro
-
 Morocco
-
 Mozambique
-
 Myanmar
-
 Namibia
-
 Nepal
-
 Netherlands
-
 New Zealand
-
 Nigeria
-
 North Macedonia
-
 Norway
-
 Oman
-
 Pakistan
-
 Palestine
-
 Panama
-
 Papua New Guinea
-
 Paraguay
-
 Peru
-
 Philippines
-
 Poland
-
 Portugal
-
 Puerto Rico
-
 Qatar
-
 Reunion
-
 Romania
-
 Rwanda
-
 Saudi Arabia
-
 Serbia
-
 Singapore
-
 Slovakia
-
 Slovenia
-
 Somalia
-
 South Africa
-
 Spain
-
 Sri Lanka
-
 Sweden
-
 Switzerland
-
 Syria
-
 Taiwan
-
 Tajikistan
-
 Tanzania
-
 Thailand
-
 Trinidad and Tobago
-
 Tunisia
-
 Turkey
-
 UAE
-
 Uganda
-
 Ukraine
-
 United Kingdom
-
United States
-
 Uruguay
-
 Uzbekistan
-
 Venezuela
-
 Vietnam
-
 Yemen
-
 Zambia
-
 Zimbabwe
- Forex
- Crypto












