

LPLA slides around 3.5% as technical signals and institutional flows point to further downside

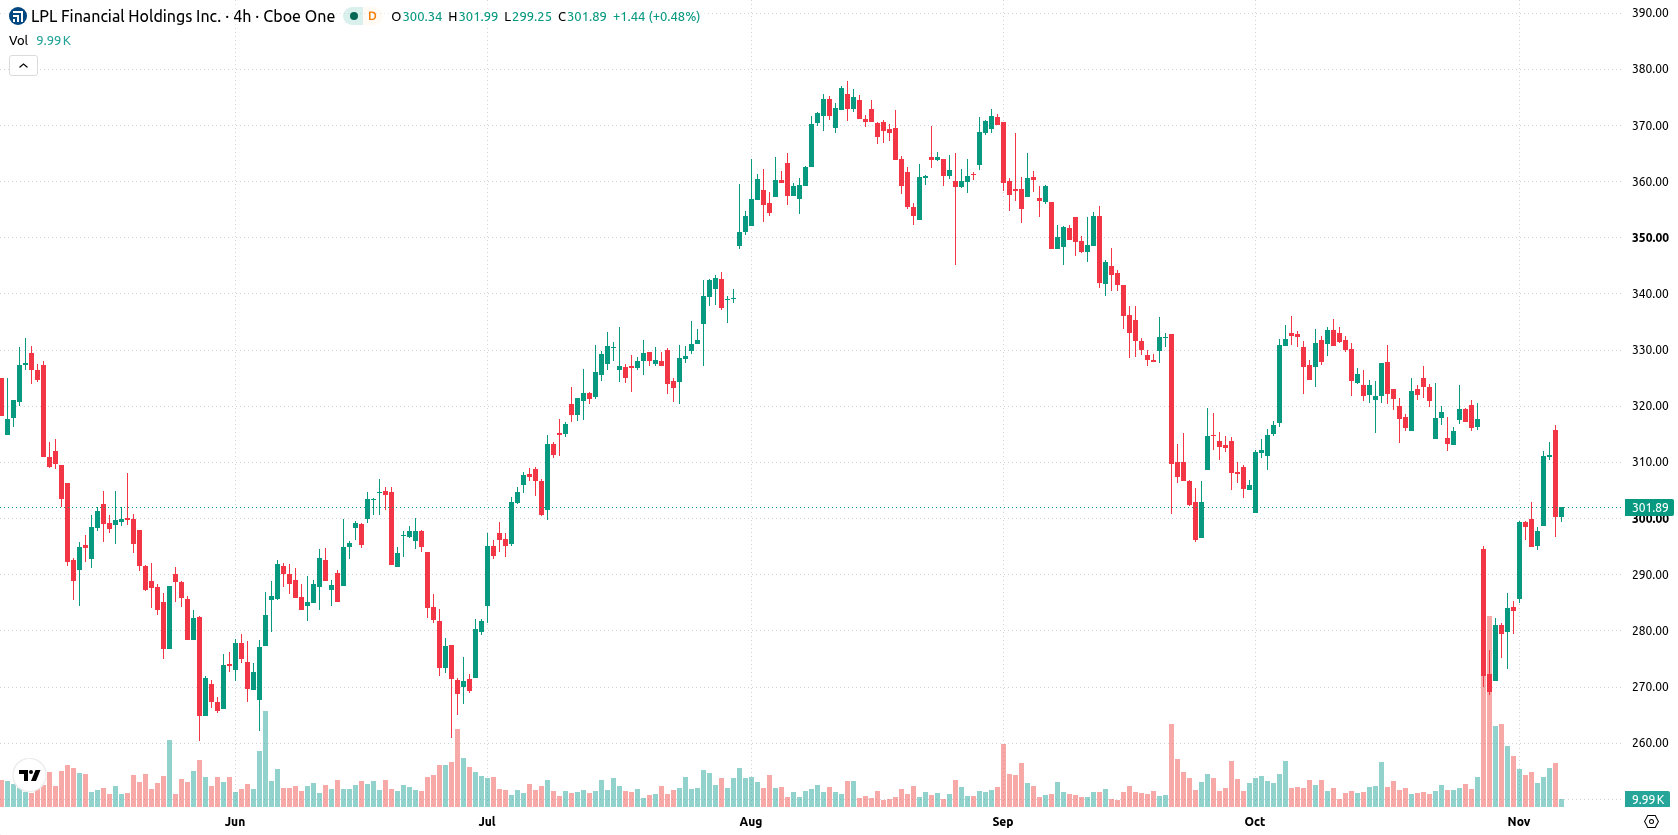
LPL Financial Holdings Inc. (LPLA) dropped 3.42% as selling pressure dominated trading, with both negative momentum signals and sustained institutional repositioning driving the move. The downside is supported by the stock's position below its short-, medium-, and long-term moving averages, which points to ongoing pressure from sellers.
 293.68
312.50
Highlights
- Bank Julius Baer & Co. Ltd Zurich initiated a new position in LPL Financial Holdings with an acquisition of 6,844 shares.
- Sumitomo Mitsui Trust Group decreased its LPL Financial Holdings stake by 3.7%, now holding 161,482 shares.
- Shares of LPL Financial Holdings trade under key moving averages with a 67% probability of moving lower in the $281.76 to $321.89 range over five days, as technical signals remain broadly negative.
Diverging institutional flows persist as broad market pressure weighs
Bank Julius Baer & Co. Ltd Zurich acquired a new position in LPL Financial Holdings Inc. during the third quarter by purchasing 6,844 shares, according to its most recent SEC filing. In the same period, Sumitomo Mitsui Trust Group Inc. reduced its holding by 3.7%, bringing its stake to 161,482 shares. Both of these filings detail recent activity by institutional investors, though price action has remained under broader selling pressure.
Conflicting momentum as technical levels signal persistent downward volatility
LPLA is trading below its 20-day, 50-day, and 200-day moving averages at $312.68, $326.59, and $321.45 respectively, highlighting persistent pressure from sellers across all timeframes. Immediate resistance is seen at the Ichimoku Kijun level of $302.22, while nearest support aligns with the session low at $296.56. There is a bullish alignment between the 50-day and 200-day moving averages, suggesting the larger trend remains constructive, but current momentum signals—including MACD and ADX—are negative and forecast continued sell pressure. The RSI and Commodity Channel Index (CCI) are both in neutral territory, while the Stochastic RSI shows an overbought reading, indicating potential overheating risk from this oscillator. Bull/Bear Power (BBP) points to intraday buyer dominance, but the Awesome Oscillator remains neutral. Volatility is elevated at 6.48%, and recent action shows wide, predominantly downward price swings. Oscillator signals are mixed, highlighting conflicting short-term momentum.
Previously it was reported that LPL Financial continued to face sustained bearish pressure amid weak technical momentum. With the stock now trading decisively below all major moving averages and institutional positioning still in flux, traders should monitor the $296.56 support as a critical level that, if breached, could signal further downward risk in the near term.






Latest LPL Financial Holdings News




-
 Afghanistan
-
 Albania
-
 Algeria
-
 Angola
-
 Argentina
-
 Armenia
-
 Australia
-
 Austria
-
 Azerbaijan
-
 Bahamas
-
 Bahrain
-
 Bangladesh
-
 Belarus
-
 Belgium
-
 Bolivia
-
 Botswana
-
 Brazil
-
 Brunei
-
 Bulgaria
-
 Cambodia
-
 Cameroon
-
 Canada
-
 Chile
-
 China
-
 Colombia
-
 Congo
-
 Costa Rica
-
 Cote d'Ivoire
-
 Croatia
-
 Cuba
-
 Cyprus
-
 Czechia
-
 DR Congo
-
 Denmark
-
 Dominican Republic
-
 Ecuador
-
 Egypt
-
 El Salvador
-
 Estonia
-
 Eswatini
-
 Ethiopia
-
 Finland
-
 France
-
 Georgia
-
 Germany
-
 Ghana
-
 Greece
-
 Haiti
-
 Hong Kong
-
 Hungary
-
 India
-
 Indonesia
-
 Iran, Islamic republic
-
 Iraq
-
 Ireland
-
 Israel
-
 Italy
-
 Jamaica
-
 Japan
-
 Jordan
-
 Kazakhstan
-
 Kenya
-
 Korea
-
 Kuwait
-
 Kyrgyzstan
-
 Laos
-
 Latvia
-
 Lebanon
-
 Lesotho
-
 Libya
-
 Lithuania
-
 Luxembourg
-
 Madagascar
-
 Malaysia
-
 Malta
-
 Mauritius
-
 Mexico
-
 Moldova
-
 Mongolia
-
 Montenegro
-
 Morocco
-
 Mozambique
-
 Myanmar
-
 Namibia
-
 Nepal
-
 Netherlands
-
 New Zealand
-
 Nigeria
-
 North Macedonia
-
 Norway
-
 Oman
-
 Pakistan
-
 Palestine
-
 Panama
-
 Papua New Guinea
-
 Paraguay
-
 Peru
-
 Philippines
-
 Poland
-
 Portugal
-
 Puerto Rico
-
 Qatar
-
 Reunion
-
 Romania
-
 Rwanda
-
 Saudi Arabia
-
 Serbia
-
 Singapore
-
 Slovakia
-
 Slovenia
-
 Somalia
-
 South Africa
-
 Spain
-
 Sri Lanka
-
 Sweden
-
 Switzerland
-
 Syria
-
 Taiwan
-
 Tajikistan
-
 Tanzania
-
 Thailand
-
 Trinidad and Tobago
-
 Tunisia
-
 Turkey
-
 UAE
-
 Uganda
-
 Ukraine
-
 United Kingdom
-
United States
-
 Uruguay
-
 Uzbekistan
-
 Venezuela
-
 Vietnam
-
 Yemen
-
 Zambia
-
 Zimbabwe
- Forex
- Crypto












