

LPLA slides over 6% as bearish momentum and weak indicators drive shares lower

LPL Financial Holdings Inc. (LPLA) dropped 6.08% under a wave of strong selling pressure, as technical signals point to persistent downward momentum and oversold conditions. The sharp slide is reinforced by the stock's sustained position below all key moving averages, which supports the bearish character of the move.
 332.83
335.43
332.83
335.43
Highlights
- Shares of LPL Financial are trading below key moving averages, showing bearish trends across all monitored timeframes.
- The stock is in oversold territory on multiple technical indicators, with immediate support at $304.02 and resistance at $318.5.
- Next five-day trading range is projected at $279.89 to $318.5, with a 70% probability of further downside movement.
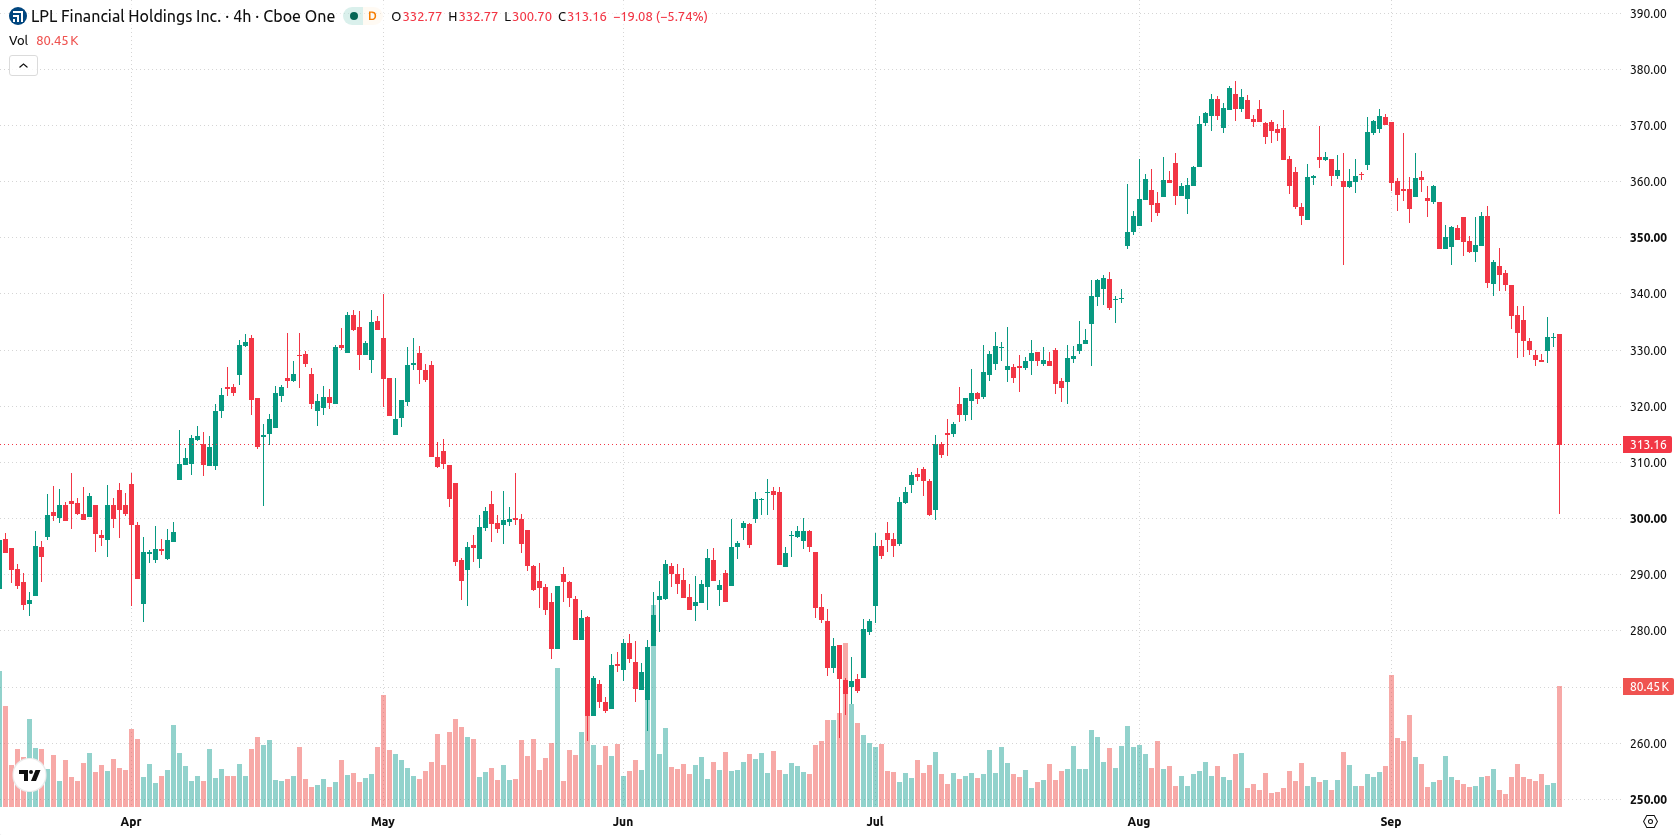
Persistent pressure as all trends turn bearish despite oversold risk
LPL Financial is trading below the 20-day moving average ($351.55), the 50-day moving average ($349.43), and the 200-day moving average ($330.32). This setup reflects sustained downward pressure across short-, medium-, and long-term trends, with a bearish technical tone even though the 50-day and 200-day averages maintain a longer-term bullish alignment. The next significant support sits at $304.02, while initial resistance stands at $318.5. Momentum indicators remain weak: MACD and ADX both signal a sell, RSI is at 37.49, and CCI has fallen to -130.97, all pointing to an oversold state. Bearish momentum is further confirmed by the BBP at -6.74, and the Stochastic RSI at 22.2 flags the potential for a near-term reversal as price exhaustion approaches. The Awesome Oscillator stays negative, with trading near the session low and intraday volatility elevated at 9.93%, highlighting the intensity of recent selling.
Earlier, analysts noted that established wealth managers like LPL Financial face mounting competitive pressures as the financial landscape evolves and technology reshapes client expectations. The latest technical signals reinforce ongoing downside risks, making $304.02 a crucial level to monitor for traders anticipating a shift in momentum or a continuation of the existing bearish trend.





Latest LPL Financial Holdings News






-
 Afghanistan
-
 Albania
-
 Algeria
-
 Angola
-
 Argentina
-
 Armenia
-
 Australia
-
 Austria
-
 Azerbaijan
-
 Bahamas
-
 Bahrain
-
 Bangladesh
-
 Belarus
-
 Belgium
-
 Bolivia
-
 Botswana
-
 Brazil
-
 Brunei
-
 Bulgaria
-
 Cambodia
-
 Cameroon
-
 Canada
-
 Chile
Chile
-
 China
China
-
 Colombia
-
 Congo
Congo
-
 Costa Rica
-
 Cote d'Ivoire
-
 Croatia
-
 Cuba
Cuba
-
 Cyprus
-
 Czechia
-
 DR Congo
-
 Denmark
-
 Dominican Republic
-
 Ecuador
-
 Egypt
Egypt
-
 El Salvador
-
 Estonia
-
 Eswatini
-
 Ethiopia
-
 Finland
-
 France
-
 Georgia
-
 Germany
-
 Ghana
Ghana
-
 Greece
-
 Haiti
Haiti
-
 Hong Kong
-
 Hungary
-
 India
India
-
 Indonesia
-
 Iran, Islamic republic
-
 Iraq
Iraq
-
 Ireland
-
 Israel
-
 Italy
Italy
-
 Jamaica
-
 Japan
Japan
-
 Jordan
-
 Kazakhstan
-
 Kenya
Kenya
-
 Korea
Korea
-
 Kuwait
-
 Kyrgyzstan
-
 Laos
Laos
-
 Latvia
-
 Lebanon
-
 Lesotho
-
 Libya
Libya
-
 Lithuania
-
 Luxembourg
-
 Madagascar
-
 Malaysia
-
 Malta
Malta
-
 Mauritius
-
 Mexico
-
 Moldova
-
 Mongolia
-
 Montenegro
-
 Morocco
-
 Mozambique
-
 Myanmar
-
 Namibia
-
 Nepal
Nepal
-
 Netherlands
-
 New Zealand
-
 Nigeria
-
 North Macedonia
-
 Norway
-
 Oman
Oman
-
 Pakistan
-
 Palestine
-
 Panama
-
 Papua New Guinea
-
 Paraguay
-
 Peru
Peru
-
 Philippines
-
 Poland
-
 Portugal
-
 Puerto Rico
-
 Qatar
Qatar
-
 Reunion
-
 Romania
-
 Rwanda
-
 Saudi Arabia
-
 Serbia
-
 Singapore
-
 Slovakia
-
 Slovenia
-
 Somalia
-
 South Africa
-
 Spain
Spain
-
 Sri Lanka
-
 Sweden
-
 Switzerland
-
 Syria
Syria
-
 Taiwan
-
 Tajikistan
-
 Tanzania
-
 Thailand
-
 Trinidad and Tobago
-
 Tunisia
-
 Turkey
-
 UAE
UAE
-
 Uganda
-
 Ukraine
-
 United Kingdom
-
United States
-
 Uruguay
-
 Uzbekistan
-
 Venezuela
-
 Vietnam
-
 Yemen
Yemen
-
 Zambia
-
 Zimbabwe
- Forex
- Crypto












