


Persistent selling pressure drove Goodyear Tire & Rubber Co (GT) down 4.52% as bearish momentum overwhelmed bids throughout the session. This move is strongly supported by the stock’s continued trading below all major moving averages and the confirmation of a dominant long-term downtrend.
 4.44
4.52
Highlights
- Shares of Goodyear trade below major moving averages, indicating persistent selling pressure across all timeframes.
- Key price levels are $4.79 as resistance and $4.62 as support, with the current price near session lows at $4.65.
- Downward momentum dominates, and technical indicators suggest an over 80% estimated probability of a further decline toward $4.5 in the next five sessions.
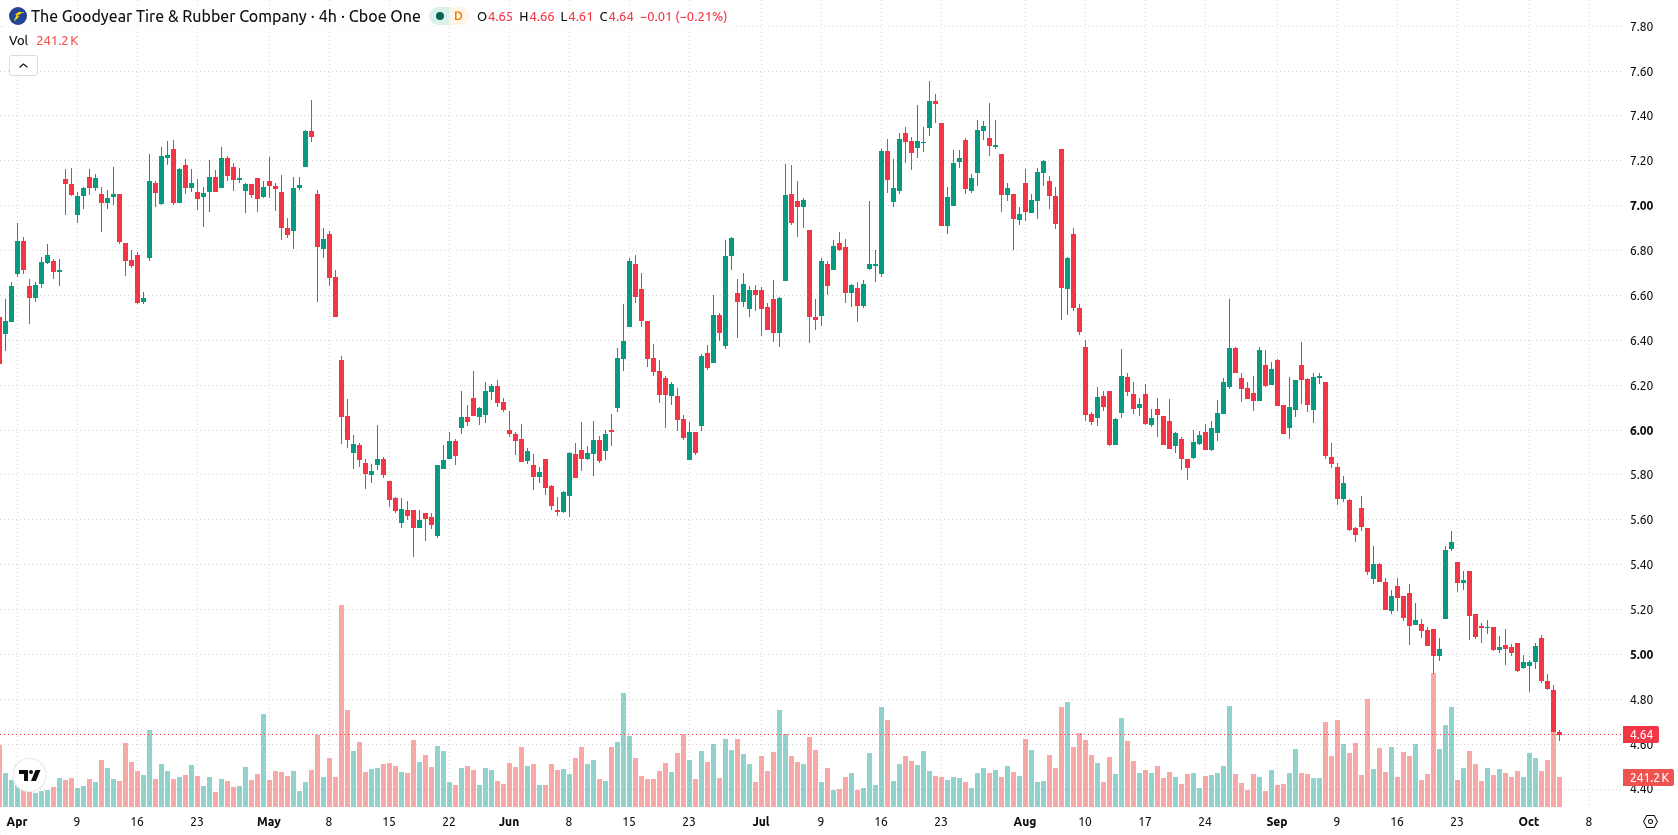
Bearish structure confirmed as momentum readings align below support
Goodyear is trading below its 20-day, 50-day, and 200-day moving averages ($5.28, $5.97, and $7.1), confirming persistent selling pressure across short-, medium-, and long-term trends. The stock is bounded by a near-term ceiling at $4.79 and a floor at $4.62, and the prevailing alignment of the 50-day against the 200-day averages signals a bearish long-term structure. Momentum readings remain negative. The Moving Average Convergence Divergence (MACD) and Average Directional Index (ADX) both signal continuing weakness, supported by the Relative Strength Index (RSI) and Commodity Channel Index (CCI) indicating the stock is nearing oversold territory. The Bull/Bear Power (BBP) sits below zero, confirming sellers dominate intraday momentum, with no overbought conditions in play. The Awesome Oscillator is neutral and does not meaningfully confirm negative pressure. On the session, Goodyear trades at $4.65, down $0.22 or 4.52%, having opened with a small downside gap near $0.04 (0.82%). The price is near session lows, intraday volatility stands at 5.41%, and the action reflects sustained selling pressure since the open. Momentum and price action are aligned to the downside.
Previously it was reported that Goodyear shares were facing sustained bearish technical pressure and lacked confirming signals for a near-term reversal. The current analysis reinforces this downtrend, with breakouts above $4.79 or below $4.62 likely to define the next significant move within an increasingly narrow trading band.






Latest Goodyear Tire & Rubber Co News




-
 Afghanistan
-
 Albania
-
 Algeria
-
 Angola
-
 Argentina
-
 Armenia
-
 Australia
-
 Austria
-
 Azerbaijan
-
 Bahamas
-
 Bahrain
-
 Bangladesh
-
 Belarus
-
 Belgium
-
 Bolivia
-
 Botswana
-
 Brazil
-
 Brunei
-
 Bulgaria
-
 Cambodia
-
 Cameroon
-
 Canada
-
 Chile
-
 China
-
 Colombia
-
 Congo
-
 Costa Rica
-
 Cote d'Ivoire
-
 Croatia
-
 Cuba
-
 Cyprus
-
 Czechia
-
 DR Congo
-
 Denmark
-
 Dominican Republic
-
 Ecuador
-
 Egypt
-
 El Salvador
-
 Estonia
-
 Eswatini
-
 Ethiopia
-
 Finland
-
 France
-
 Georgia
-
 Germany
-
 Ghana
-
 Greece
-
 Haiti
-
 Hong Kong
-
 Hungary
-
 India
-
 Indonesia
-
 Iran, Islamic republic
-
 Iraq
-
 Ireland
-
 Israel
-
 Italy
-
 Jamaica
-
 Japan
-
 Jordan
-
 Kazakhstan
-
 Kenya
-
 Korea
-
 Kuwait
-
 Kyrgyzstan
-
 Laos
-
 Latvia
-
 Lebanon
-
 Lesotho
-
 Libya
-
 Lithuania
-
 Luxembourg
-
 Madagascar
-
 Malaysia
-
 Malta
-
 Mauritius
-
 Mexico
-
 Moldova
-
 Mongolia
-
 Montenegro
-
 Morocco
-
 Mozambique
-
 Myanmar
-
 Namibia
-
 Nepal
-
 Netherlands
-
 New Zealand
-
 Nigeria
-
 North Macedonia
-
 Norway
-
 Oman
-
 Pakistan
-
 Palestine
-
 Panama
-
 Papua New Guinea
-
 Paraguay
-
 Peru
-
 Philippines
-
 Poland
-
 Portugal
-
 Puerto Rico
-
 Qatar
-
 Reunion
-
 Romania
-
 Rwanda
-
 Saudi Arabia
-
 Serbia
-
 Singapore
-
 Slovakia
-
 Slovenia
-
 Somalia
-
 South Africa
-
 Spain
-
 Sri Lanka
-
 Sweden
-
 Switzerland
-
 Syria
-
 Taiwan
-
 Tajikistan
-
 Tanzania
-
 Thailand
-
 Trinidad and Tobago
-
 Tunisia
-
 Turkey
-
 UAE
-
 Uganda
-
 Ukraine
-
 United Kingdom
-
United States
-
 Uruguay
-
 Uzbekistan
-
 Venezuela
-
 Vietnam
-
 Yemen
-
 Zambia
-
 Zimbabwe
- Forex
- Crypto












