

$4.85 support test: Can Goodyear stock avoid deeper losses?

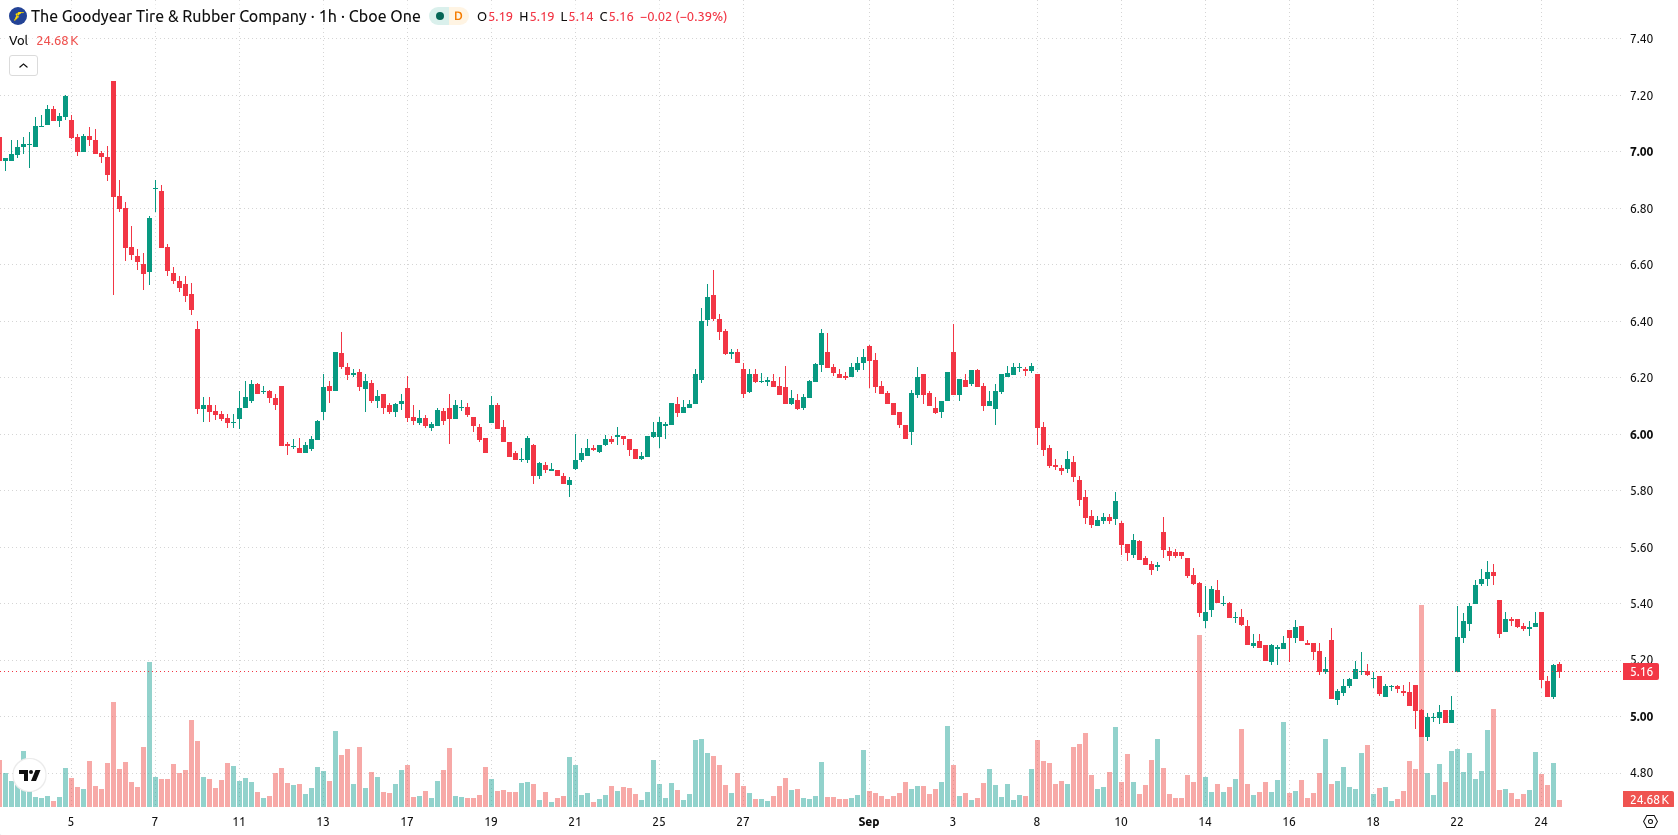
Goodyear (GT) stock is trading at $5.17, down 3.25% on the day. The price remains below its key moving averages, indicating continued pressure following today's move.
 3.72
4.15
Highlights
- GT/USD trades below key moving averages, facing persistent downside pressure across all timeframes and immediate resistance at $5.23.
- Momentum signals are neutral to weak and several oversold oscillators indicate the asset nears oversold conditions with continued seller dominance.
- The expected 2 to 3 day price range is $4.85 to $5.45, with a 71% probability of further decline and a 29% chance of an upward move.
Technical support tested as oversold signals diverge from momentum
GT is trading below the MA-20 at $5.28, the MA-50 at $5.20, and well below the MA-200 at $7.23. The Ichimoku Kijun currently stands at $5.23, forming immediate resistance. MACD and ADX point to neutral to weak momentum, with ADX indicating a 'Sell' environment. RSI is at 37.1, while both Stochastic RSI and CCI are in oversold territory. Bull/Bear Power demonstrates seller dominance intraday, and the Awesome Oscillator remains neutral, not reinforcing current downside pressure. Intraday, GT opened with a marginal gap up and is fluctuating near the midpoint of today’s volatile range. Momentum and oversold oscillator signals diverge, as persistent selling pressure is not confirmed by all momentum indicators.
Sideways trading projected as bearish probability remains elevated
Over the next 2 to 3 trading days, GT is expected to trade in a range between $4.85 and $5.45. There is a 29% probability of a short-term rebound, while the likelihood of further decline is 71%. The baseline scenario involves price moving sideways within this corridor. A break above $5.23 would open a bullish scenario, while a move below $4.85 would likely extend the current downtrend.
Previously it was reported that Goodyear shares were under sustained bearish technical pressure, with negative momentum prevailing across key indicators. The current analysis reinforces this outlook, highlighting continued weakness and seller dominance, with the $5.23 resistance level serving as a pivotal signal for any potential reversal.






Latest Goodyear Tire & Rubber Co News





-
 Afghanistan
-
 Albania
-
 Algeria
-
 Angola
-
 Argentina
-
 Armenia
-
 Australia
-
 Austria
-
 Azerbaijan
-
 Bahamas
-
 Bahrain
-
 Bangladesh
-
 Belarus
-
 Belgium
-
 Bolivia
-
 Botswana
-
 Brazil
-
 Brunei
-
 Bulgaria
-
 Cambodia
-
 Cameroon
-
 Canada
-
 Chile
-
 China
-
 Colombia
-
 Congo
-
 Costa Rica
-
 Cote d'Ivoire
-
 Croatia
-
 Cuba
-
 Cyprus
-
 Czechia
-
 DR Congo
-
 Denmark
-
 Dominican Republic
-
 Ecuador
-
 Egypt
-
 El Salvador
-
 Estonia
-
 Eswatini
-
 Ethiopia
-
 Finland
-
 France
-
 Georgia
-
 Germany
-
 Ghana
-
 Greece
-
 Haiti
-
 Hong Kong
-
 Hungary
-
 India
-
 Indonesia
-
 Iran, Islamic republic
-
 Iraq
-
 Ireland
-
 Israel
-
 Italy
-
 Jamaica
-
 Japan
-
 Jordan
-
 Kazakhstan
-
 Kenya
-
 Korea
-
 Kuwait
-
 Kyrgyzstan
-
 Laos
-
 Latvia
-
 Lebanon
-
 Lesotho
-
 Libya
-
 Lithuania
-
 Luxembourg
-
 Madagascar
-
 Malaysia
-
 Malta
-
 Mauritius
-
 Mexico
-
 Moldova
-
 Mongolia
-
 Montenegro
-
 Morocco
-
 Mozambique
-
 Myanmar
-
 Namibia
-
 Nepal
-
 Netherlands
-
 New Zealand
-
 Nigeria
-
 North Macedonia
-
 Norway
-
 Oman
-
 Pakistan
-
 Palestine
-
 Panama
-
 Papua New Guinea
-
 Paraguay
-
 Peru
-
 Philippines
-
 Poland
-
 Portugal
-
 Puerto Rico
-
 Qatar
-
 Reunion
-
 Romania
-
 Rwanda
-
 Saudi Arabia
-
 Serbia
-
 Singapore
-
 Slovakia
-
 Slovenia
-
 Somalia
-
 South Africa
-
 Spain
-
 Sri Lanka
-
 Sweden
-
 Switzerland
-
 Syria
-
 Taiwan
-
 Tajikistan
-
 Tanzania
-
 Thailand
-
 Trinidad and Tobago
-
 Tunisia
-
 Turkey
-
 UAE
-
 Uganda
-
 Ukraine
-
 United Kingdom
-
United States
-
 Uruguay
-
 Uzbekistan
-
 Venezuela
-
 Vietnam
-
 Yemen
-
 Zambia
-
 Zimbabwe
- Forex
- Crypto












