


Revvity Inc. (RVTY) surged 2.91% on powerful technical momentum, as buyers drove the stock sharply higher in the absence of fresh corporate catalysts. The advance is supported by a sustained rally above all key moving averages, with strong bullish alignment reinforcing upward conviction.
 160.07
169.01
Highlights
- Revvity stock is trading with strong bullish momentum, holding well above key short, medium, and long-term averages.
- Momentum indicators give consistent buy signals but warn the stock is overbought, with intraday action staying near session highs.
- Immediate support is at $155.4 and resistance at $158.2, with a projected five-day range of $150.94 to $160.7 and over 80% probability of further upside.
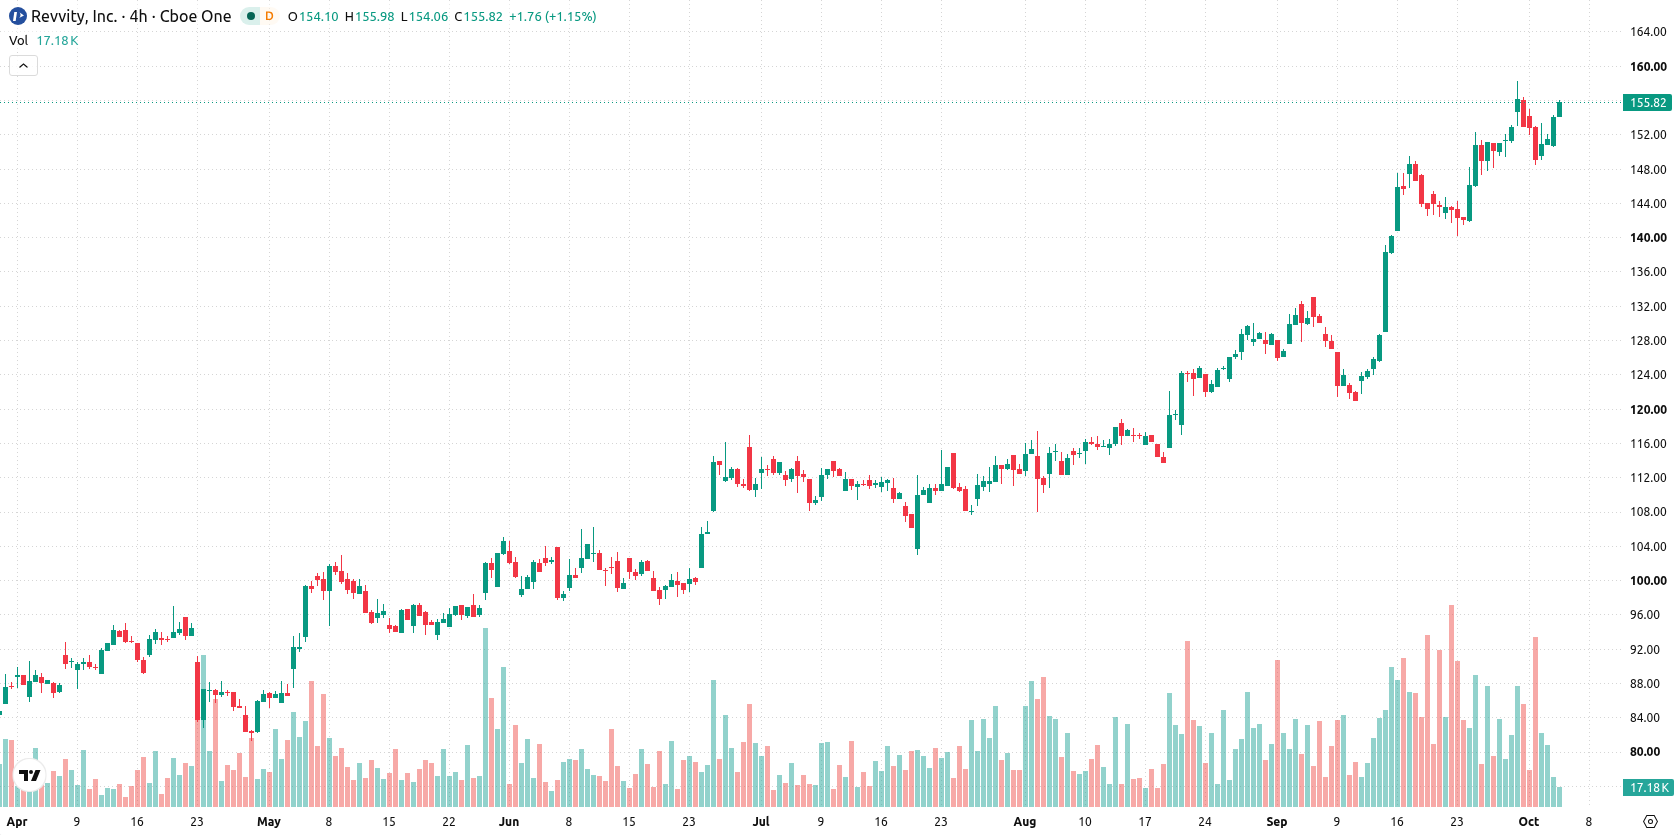
Overbought signals emerge as bullish momentum and support hold
Revvity is trading well above its 20-day ($140.97), 50-day ($127.82), and 200-day ($106.26) moving averages, reinforcing strong bullish momentum across the short, medium, and long-term timeframes. Immediate levels to watch are a near-term floor at $155.4 and a ceiling at $158.2, with long-term bullish alignment confirmed by the 50-day versus 200-day average. Momentum is robust, as both the Moving Average Convergence Divergence (MACD) and Average Directional Index (ADX) give clear buy signals, aligning with bullish readings from the Commodity Channel Index (CCI) and the Relative Strength Index (RSI), which stands at 68.9. The Bull/Bear Power (BBP) value of 6.78 signals that buyers dominate intraday momentum, but the indicator warns that the stock is overbought. Intraday action shows strength toward the highs, as momentum indicators largely confirm the rally despite a neutral tone from the Stochastic RSI and the Awesome Oscillator.
Earlier, analysts noted that Revvity’s strong technical setup and persistent momentum supported a bullish outlook. The current analysis reinforces this perspective, with continued alignment across key indicators and an actionable focus on the $158.2 resistance as the critical level to watch for a potential breakout.






Latest Revvity Inc News



-
 Afghanistan
-
 Albania
-
 Algeria
-
 Angola
-
 Argentina
-
 Armenia
-
 Australia
-
 Austria
-
 Azerbaijan
-
 Bahamas
-
 Bahrain
-
 Bangladesh
-
 Belarus
-
 Belgium
-
 Bolivia
-
 Botswana
-
 Brazil
-
 Brunei
-
 Bulgaria
-
 Cambodia
-
 Cameroon
-
 Canada
-
 Chile
-
 China
-
 Colombia
-
 Congo
-
 Costa Rica
-
 Cote d'Ivoire
-
 Croatia
-
 Cuba
-
 Cyprus
-
 Czechia
-
 DR Congo
-
 Denmark
-
 Dominican Republic
-
 Ecuador
-
 Egypt
-
 El Salvador
-
 Estonia
-
 Eswatini
-
 Ethiopia
-
 Finland
-
 France
-
 Georgia
-
 Germany
-
 Ghana
-
 Greece
-
 Haiti
-
 Hong Kong
-
 Hungary
-
 India
-
 Indonesia
-
 Iran, Islamic republic
-
 Iraq
-
 Ireland
-
 Israel
-
 Italy
-
 Jamaica
-
 Japan
-
 Jordan
-
 Kazakhstan
-
 Kenya
-
 Korea
-
 Kuwait
-
 Kyrgyzstan
-
 Laos
-
 Latvia
-
 Lebanon
-
 Lesotho
-
 Libya
-
 Lithuania
-
 Luxembourg
-
 Madagascar
-
 Malaysia
-
 Malta
-
 Mauritius
-
 Mexico
-
 Moldova
-
 Mongolia
-
 Montenegro
-
 Morocco
-
 Mozambique
-
 Myanmar
-
 Namibia
-
 Nepal
-
 Netherlands
-
 New Zealand
-
 Nigeria
-
 North Macedonia
-
 Norway
-
 Oman
-
 Pakistan
-
 Palestine
-
 Panama
-
 Papua New Guinea
-
 Paraguay
-
 Peru
-
 Philippines
-
 Poland
-
 Portugal
-
 Puerto Rico
-
 Qatar
-
 Reunion
-
 Romania
-
 Rwanda
-
 Saudi Arabia
-
 Serbia
-
 Singapore
-
 Slovakia
-
 Slovenia
-
 Somalia
-
 South Africa
-
 Spain
-
 Sri Lanka
-
 Sweden
-
 Switzerland
-
 Syria
-
 Taiwan
-
 Tajikistan
-
 Tanzania
-
 Thailand
-
 Trinidad and Tobago
-
 Tunisia
-
 Turkey
-
 UAE
-
 Uganda
-
 Ukraine
-
 United Kingdom
-
United States
-
 Uruguay
-
 Uzbekistan
-
 Venezuela
-
 Vietnam
-
 Yemen
-
 Zambia
-
 Zimbabwe
- Forex
- Crypto












