


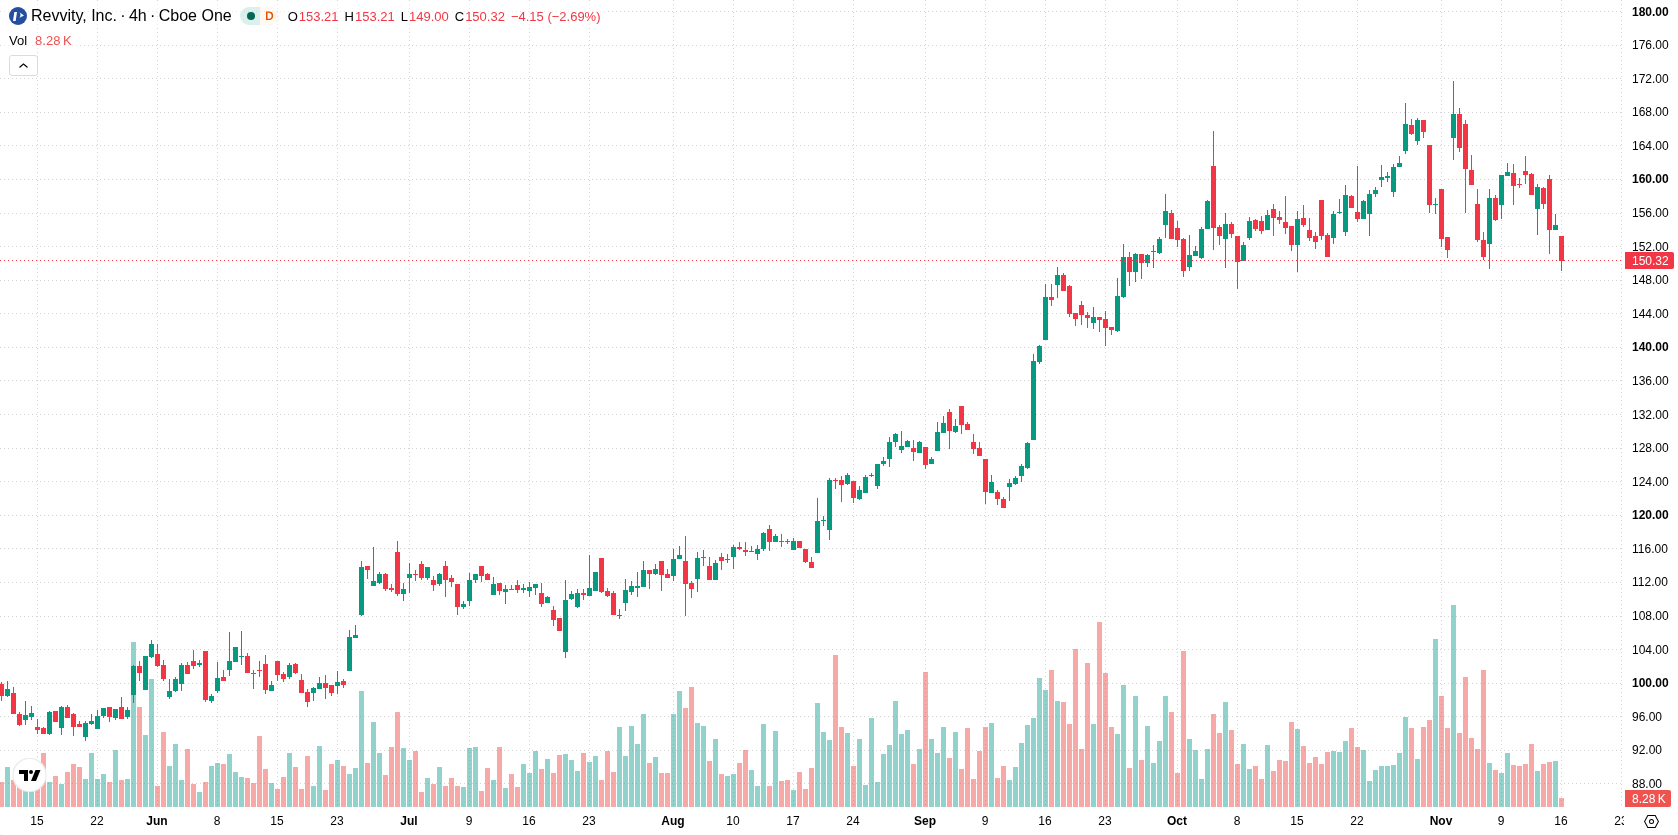
Revvity Inc (RVTY) fell 3.36% as selling pressure took hold, even as recent quarterly earnings and institutional activity brought fundamentally positive news. The decline is supported by a weak short- and medium-term technical structure, with shares trading below their 20-day and 50-day moving averages and facing near-term resistance.
 152.90
162.33
Highlights
- Revvity reported earnings per share of $1.38 and revenue of $728.90 million, both above consensus estimates.
- Institutional ownership exceeded 86% with major increases from Aberdeen Group plc, Eurizon Capital SGR S.p.A., Jefferies Financial Group Inc., and Fulcrum Asset Management LLP.
- Revvity stock trades below short-term resistance, with indicators showing mixed momentum and an expected five-day range of $143.66 to $157.98.
Strength in earnings and institutional buying as selling persists
Revvity reported earnings per share of $1.38 and quarterly revenue of $728.90 million, surpassing consensus estimates. Institutional ownership exceeded 86%, with major increases in holdings by Aberdeen Group plc, Eurizon Capital SGR S.p.A., Jefferies Financial Group Inc., and Fulcrum Asset Management LLP. The company also provided a quarterly dividend with a yield of 0.2%, though price action has remained under broader selling pressure.
Short-term downside prevails as indicators signal mixed momentum
RVTY is trading below both its 20-day and 50-day moving averages at $158.03 and $150.41, respectively, and remains above the longer-term 200-day moving average at $114.04. This setup points to short- and medium-term weakness beneath resistance, but a constructive long-term structure. The near-term ceiling is $150.41, and the near-term floor is $143.66. Momentum signals are mixed. The MACD indicates strong buy momentum, while the ADX and CCI suggest ongoing selling pressure, reinforced by a bearish Hull Moving Average. The RSI and CCI are neutral, but the Stochastic RSI sits in the oversold zone, hinting at potential selling exhaustion. Intraday, Bull/Bear Power remains positive, the Awesome Oscillator is bullish, but the stock closed near the session low within a volatile trading band after an initial upside gap.
Earlier, analysts noted that Revvity had demonstrated strong bullish momentum following the launch of its Signals LabGistics AI platform. The current technical setup, however, indicates a shift to short- and medium-term weakness, with traders advised to monitor the $143.66 support level for signs of a further breakdown.






Latest Revvity Inc News



-
 Afghanistan
-
 Albania
-
 Algeria
-
 Angola
-
 Argentina
-
 Armenia
-
 Australia
-
 Austria
-
 Azerbaijan
-
 Bahamas
-
 Bahrain
-
 Bangladesh
-
 Belarus
-
 Belgium
-
 Bolivia
-
 Botswana
-
 Brazil
-
 Brunei
-
 Bulgaria
-
 Cambodia
-
 Cameroon
-
 Canada
-
 Chile
-
 China
-
 Colombia
-
 Congo
-
 Costa Rica
-
 Cote d'Ivoire
-
 Croatia
-
 Cuba
-
 Cyprus
-
 Czechia
-
 DR Congo
-
 Denmark
-
 Dominican Republic
-
 Ecuador
-
 Egypt
-
 El Salvador
-
 Estonia
-
 Eswatini
-
 Ethiopia
-
 Finland
-
 France
-
 Georgia
-
 Germany
-
 Ghana
-
 Greece
-
 Haiti
-
 Hong Kong
-
 Hungary
-
 India
-
 Indonesia
-
 Iran, Islamic republic
-
 Iraq
-
 Ireland
-
 Israel
-
 Italy
-
 Jamaica
-
 Japan
-
 Jordan
-
 Kazakhstan
-
 Kenya
-
 Korea
-
 Kuwait
-
 Kyrgyzstan
-
 Laos
-
 Latvia
-
 Lebanon
-
 Lesotho
-
 Libya
-
 Lithuania
-
 Luxembourg
-
 Madagascar
-
 Malaysia
-
 Malta
-
 Mauritius
-
 Mexico
-
 Moldova
-
 Mongolia
-
 Montenegro
-
 Morocco
-
 Mozambique
-
 Myanmar
-
 Namibia
-
 Nepal
-
 Netherlands
-
 New Zealand
-
 Nigeria
-
 North Macedonia
-
 Norway
-
 Oman
-
 Pakistan
-
 Palestine
-
 Panama
-
 Papua New Guinea
-
 Paraguay
-
 Peru
-
 Philippines
-
 Poland
-
 Portugal
-
 Puerto Rico
-
 Qatar
-
 Reunion
-
 Romania
-
 Rwanda
-
 Saudi Arabia
-
 Serbia
-
 Singapore
-
 Slovakia
-
 Slovenia
-
 Somalia
-
 South Africa
-
 Spain
-
 Sri Lanka
-
 Sweden
-
 Switzerland
-
 Syria
-
 Taiwan
-
 Tajikistan
-
 Tanzania
-
 Thailand
-
 Trinidad and Tobago
-
 Tunisia
-
 Turkey
-
 UAE
-
 Uganda
-
 Ukraine
-
 United Kingdom
-
United States
-
 Uruguay
-
 Uzbekistan
-
 Venezuela
-
 Vietnam
-
 Yemen
-
 Zambia
-
 Zimbabwe
- Forex
- Crypto












