

Goldman Sachs stock weekly forecast: Persistent downside pressure as price action stalls below resistance

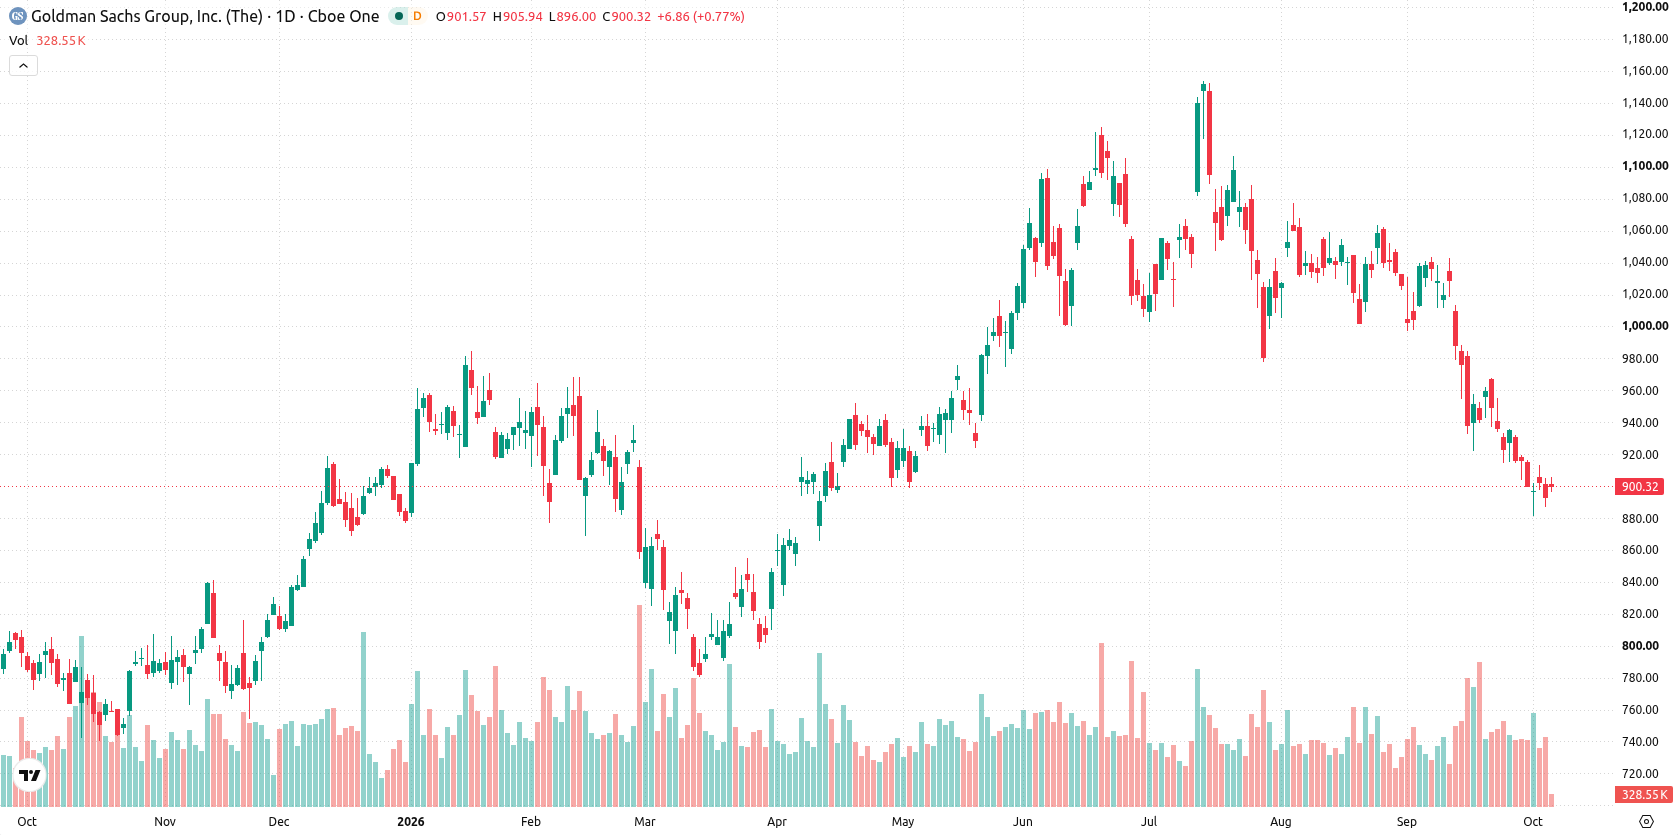
Shares of Goldman Sachs Group, Inc. (GS) are trading near $902 as the stock stretches further into oversold territory this week. Despite muted movement, persistent downside momentum is keeping pressure on the shares, and bearish sentiment is likely to shape the market’s tone in the days ahead.
 904.11
939.28
Highlights
- Shares of Goldman Sachs closed at $901.56, moving slightly lower during the past week and holding below key moving averages.
- Daily technical indicators show weak momentum and oversold conditions, with prevailing bearish signals across multiple trend and volatility measures.
- The stock faces support at $881.25 and resistance at $914.45, with an expected trading range of $886.71 to $916.4 and a high probability of further declines if support is breached.
Dividend hike and share buybacks offset by bear market status and IPO exposure
Goldman Sachs increased its quarterly dividend to $5.00 per share, up from $4.50, with the next payout set for September 29, 2026, according to 24/7 Wall St. The company also continued aggressive share buybacks, reducing outstanding shares substantially over the first half of 2026. GuruFocus reported that as of October 2, 2026, GS shares entered bear market territory following a drop of over 20% from the July 2026 peak, with further attention on a $220 million investment in Shein after its IPO.
Bearish technical signals strengthen as volatility climbs within weekly band
On the daily chart, the structure remains weak with price action confined to the upper part of the recent weekly range, while volatility reached 3.77%. MACD, ADX and the Awesome Oscillator all support a bearish tilt, and both CCI (-107.14) and Stochastic RSI (10.67) are in oversold territory, signalling stretched downside momentum. The nearest support sits at $881.25 and resistance is at $914.45, with the Ichimoku Kijun at $964.32 reinforcing overhead resistance. Daily momentum shows an emerging move lower that is not yet confirmed, so further direction will hinge on whether support or resistance is tested next.
High probability of further downside as key support and resistance define range
Over the coming trading week, the expected range is $886.71 to $916.4. There is a very low probability of an increase and a very high probability of a decrease. The base case is for the shares to remain within this band, with a breakout above $914.45 required to force short-term upside, while a decisive move below $881.25 would open the way for further declines.
Earlier, analysts noted that Goldman Sachs shares faced persistent downside risks amid leadership uncertainty and ongoing volatility. The current analysis reinforces this bearish outlook, with stretched downside momentum and oversold technicals highlighting $881.25 as a critical level to watch for potential further declines.






Latest Goldman Sachs News




-
 Afghanistan
-
 Albania
-
 Algeria
-
 Angola
-
 Argentina
-
 Armenia
-
 Australia
-
 Austria
-
 Azerbaijan
-
 Bahamas
-
 Bahrain
-
 Bangladesh
-
 Belarus
-
 Belgium
-
 Bolivia
-
 Botswana
-
 Brazil
-
 Brunei
-
 Bulgaria
-
 Cambodia
-
 Cameroon
-
 Canada
-
 Chile
-
 China
-
 Colombia
-
 Congo
-
 Costa Rica
-
 Cote d'Ivoire
-
 Croatia
-
 Cuba
-
 Cyprus
-
 Czechia
-
 DR Congo
-
 Denmark
-
 Dominican Republic
-
 Ecuador
-
 Egypt
-
 El Salvador
-
 Estonia
-
 Eswatini
-
 Ethiopia
-
 Finland
-
 France
-
 Georgia
-
 Germany
-
 Ghana
-
 Greece
-
 Haiti
-
 Hong Kong
-
 Hungary
-
 India
-
 Indonesia
-
 Iran, Islamic republic
-
 Iraq
-
 Ireland
-
 Israel
-
 Italy
-
 Jamaica
-
 Japan
-
 Jordan
-
 Kazakhstan
-
 Kenya
-
 Korea
-
 Kuwait
-
 Kyrgyzstan
-
 Laos
-
 Latvia
-
 Lebanon
-
 Lesotho
-
 Libya
-
 Lithuania
-
 Luxembourg
-
 Madagascar
-
 Malaysia
-
 Malta
-
 Mauritius
-
 Mexico
-
 Moldova
-
 Mongolia
-
 Montenegro
-
 Morocco
-
 Mozambique
-
 Myanmar
-
 Namibia
-
 Nepal
-
 Netherlands
-
 New Zealand
-
 Nigeria
-
 North Macedonia
-
 Norway
-
 Oman
-
 Pakistan
-
 Palestine
-
 Panama
-
 Papua New Guinea
-
 Paraguay
-
 Peru
-
 Philippines
-
 Poland
-
 Portugal
-
 Puerto Rico
-
 Qatar
-
 Reunion
-
 Romania
-
 Rwanda
-
 Saudi Arabia
-
 Serbia
-
 Singapore
-
 Slovakia
-
 Slovenia
-
 Somalia
-
 South Africa
-
 Spain
-
 Sri Lanka
-
 Sweden
-
 Switzerland
-
 Syria
-
 Taiwan
-
 Tajikistan
-
 Tanzania
-
 Thailand
-
 Trinidad and Tobago
-
 Tunisia
-
 Turkey
-
 UAE
-
 Uganda
-
 Ukraine
-
 United Kingdom
-
United States
-
 Uruguay
-
 Uzbekistan
-
 Venezuela
-
 Vietnam
-
 Yemen
-
 Zambia
-
 Zimbabwe
- Forex
- Crypto












