

Goldman Sachs stock weekly forecast: Decline stretches into oversold territory

Shares of Goldman Sachs Group, Inc. (GS) are trading near $914 as a nearly 2% slide this week drives price action deeper into a decline setup. Corporate headlines around executive succession planning and institutional fund initiatives have done little to reverse selling pressure. The focus for the coming week is on whether the downtrend can moderate or if oversold momentum accelerates further losses.
 915.33
939.28
Highlights
- Shares of Goldman Sachs fell 2.2% over the past 7 days to $914.24, trading below key moving averages.
- Short-term momentum remains negative, with oversold technical indicator readings and strong resistance at $914.5 and $989.01.
- The expected trading range for the coming week is $896.47 to $932, with probability skewed toward further declines.
Leadership uncertainty and product shifts drive volatility over the week
Goldman Sachs has initiated board-level discussions about a potential CEO transition, with David Solomon’s tenure under review as of September 28, 2026, according to GuruFocus. The company also expanded access to its $100 billion Treasury fund (FTIXX) for institutional digital asset clients through Lynq and Link, but has not issued tokenized fund shares, Coindesk and digitaltoday.co.kr reported. GS recently delivered a solid three-year share price gain and maintains a $20.69 annual dividend with a 31.82% payout ratio, as noted by Yahoo Finance, while its weighting in major ETFs remains high. Leadership uncertainty and shifting institutional product offerings may continue to drive volatility in the week ahead.
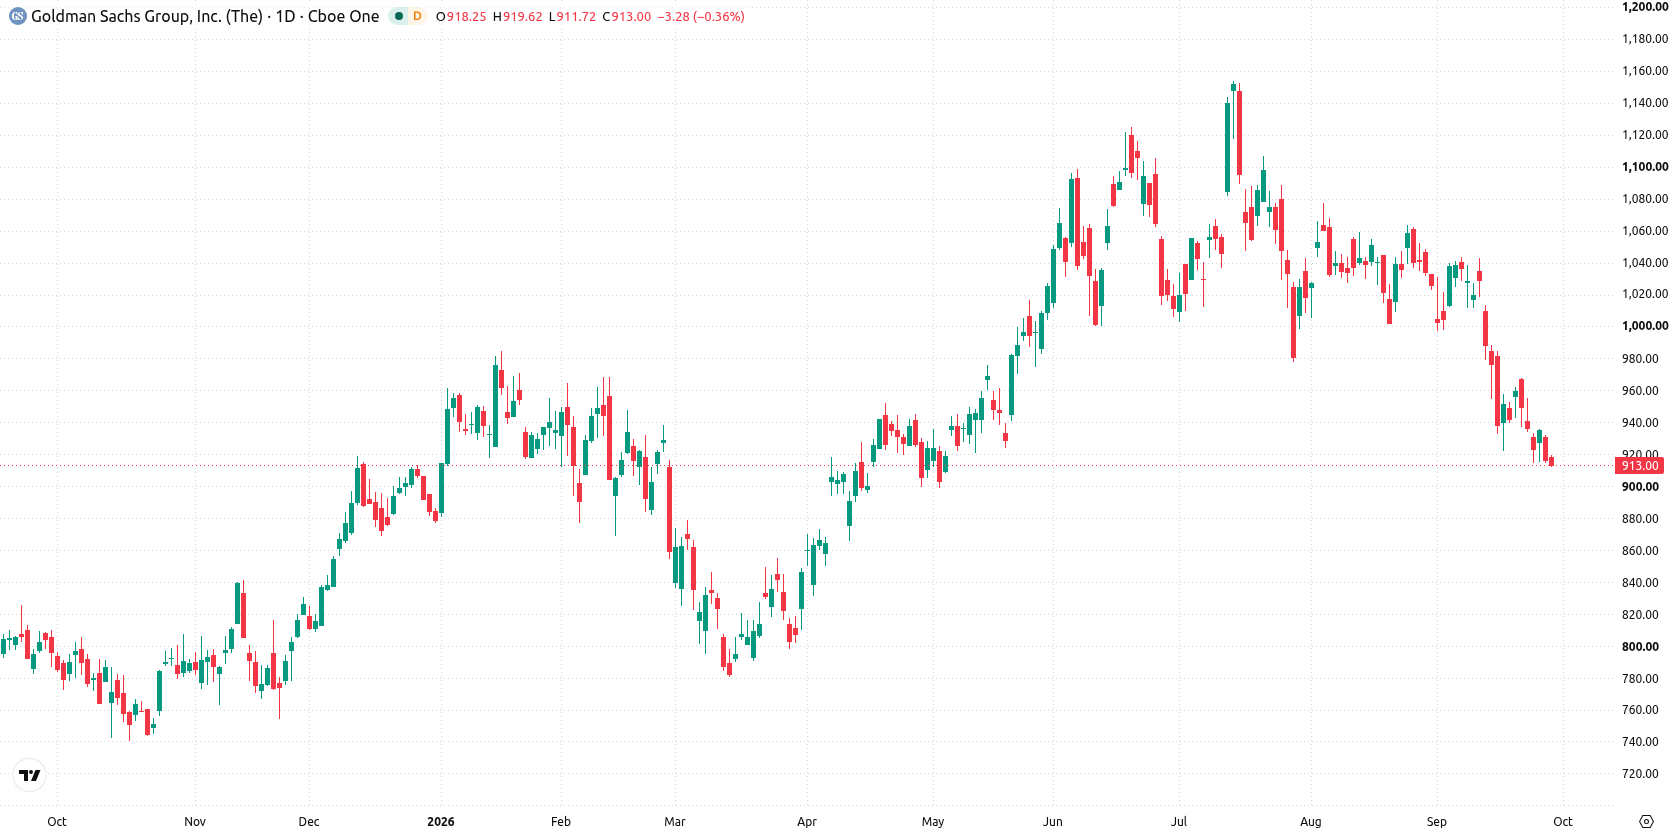
Bearish momentum persists as RSI and CCI approach oversold zones this week
On the daily chart, the setup is defined by a contained move within a narrow range and volatility at 4.34%. The stock is pressing against resistance at $914.5, while momentum remains heavy with the RSI at 33.03 approaching oversold and CCI firmly in the oversold zone. Bearish momentum is further underscored by negative signals from both the MACD and Bull/Bear Power. The Ichimoku Kijun at $989.01 presents another practical resistance level, suggesting further upside will meet strong headwinds.
Downside risks dominate as consolidation likely below resistance in coming week
In the week ahead, the expected range is $896.47 to $932, with a very low probability of an increase and a very high probability of a decrease. The base case is for the stock to consolidate below $914.5, with risk skewed to the downside. A sustained move above $914.5 could open a retest of higher resistance toward $932, but failure to hold $896.47 would likely trigger further declines.
Earlier, analysts noted that Goldman Sachs shares were exhibiting a neutral-to-bearish technical structure with persistent resistance and downside risk. This outlook is reinforced by the current extension of bearish momentum and leadership uncertainties, with traders advised to monitor $896.47 as the next critical level that could define the direction of further moves.






Latest Goldman Sachs News




-
 Afghanistan
-
 Albania
-
 Algeria
-
 Angola
-
 Argentina
-
 Armenia
-
 Australia
-
 Austria
-
 Azerbaijan
-
 Bahamas
-
 Bahrain
-
 Bangladesh
-
 Belarus
-
 Belgium
-
 Bolivia
-
 Botswana
-
 Brazil
-
 Brunei
-
 Bulgaria
-
 Cambodia
-
 Cameroon
-
 Canada
-
 Chile
-
 China
-
 Colombia
-
 Congo
-
 Costa Rica
-
 Cote d'Ivoire
-
 Croatia
-
 Cuba
-
 Cyprus
-
 Czechia
-
 DR Congo
-
 Denmark
-
 Dominican Republic
-
 Ecuador
-
 Egypt
-
 El Salvador
-
 Estonia
-
 Eswatini
-
 Ethiopia
-
 Finland
-
 France
-
 Georgia
-
 Germany
-
 Ghana
-
 Greece
-
 Haiti
-
 Hong Kong
-
 Hungary
-
 India
-
 Indonesia
-
 Iran, Islamic republic
-
 Iraq
-
 Ireland
-
 Israel
-
 Italy
-
 Jamaica
-
 Japan
-
 Jordan
-
 Kazakhstan
-
 Kenya
-
 Korea
-
 Kuwait
-
 Kyrgyzstan
-
 Laos
-
 Latvia
-
 Lebanon
-
 Lesotho
-
 Libya
-
 Lithuania
-
 Luxembourg
-
 Madagascar
-
 Malaysia
-
 Malta
-
 Mauritius
-
 Mexico
-
 Moldova
-
 Mongolia
-
 Montenegro
-
 Morocco
-
 Mozambique
-
 Myanmar
-
 Namibia
-
 Nepal
-
 Netherlands
-
 New Zealand
-
 Nigeria
-
 North Macedonia
-
 Norway
-
 Oman
-
 Pakistan
-
 Palestine
-
 Panama
-
 Papua New Guinea
-
 Paraguay
-
 Peru
-
 Philippines
-
 Poland
-
 Portugal
-
 Puerto Rico
-
 Qatar
-
 Reunion
-
 Romania
-
 Rwanda
-
 Saudi Arabia
-
 Serbia
-
 Singapore
-
 Slovakia
-
 Slovenia
-
 Somalia
-
 South Africa
-
 Spain
-
 Sri Lanka
-
 Sweden
-
 Switzerland
-
 Syria
-
 Taiwan
-
 Tajikistan
-
 Tanzania
-
 Thailand
-
 Trinidad and Tobago
-
 Tunisia
-
 Turkey
-
 UAE
-
 Uganda
-
 Ukraine
-
 United Kingdom
-
United States
-
 Uruguay
-
 Uzbekistan
-
 Venezuela
-
 Vietnam
-
 Yemen
-
 Zambia
-
 Zimbabwe
- Forex
- Crypto












