

Goldman Sachs stock weekly forecast: Support at $923.99 comes into focus

Shares of Goldman Sachs Group, Inc. (GS) are trading near $952 after gaining just over 1% this week, as a stretch into oversold territory dominates the setup. A recent decline has brought momentum into question and shifts focus to immediate support for the week ahead.
 827.90
908.99
Highlights
- Shares of Goldman Sachs advanced $9.44 over the past 7 days to $951.52, remaining under key moving averages.
- Technical indicators show bearish long-term structure and oversold conditions, with mixed signals countering immediate directional clarity.
- Goldman Sachs stock is expected to trade between $924.58 and $978.45 next week, with 65% probability of a decrease.
Fed rate hikes and international moves drive sentiment after earnings and India anchor stake
Goldman Sachs made headlines after being named a significant anchor investor in the National Stock Exchange of India's pre-IPO fundraising, according to The Economic Times. TheStreet reported that the firm's annual revenue reached $117.10 billion and net profit stood at $16.30 billion, with shares reacting to continued pressure from Federal Reserve rate hikes. Additionally, the firm updated its S&P 500 year-end target, but attention remains on the combination of rate policy and international market activity impacting sentiment.
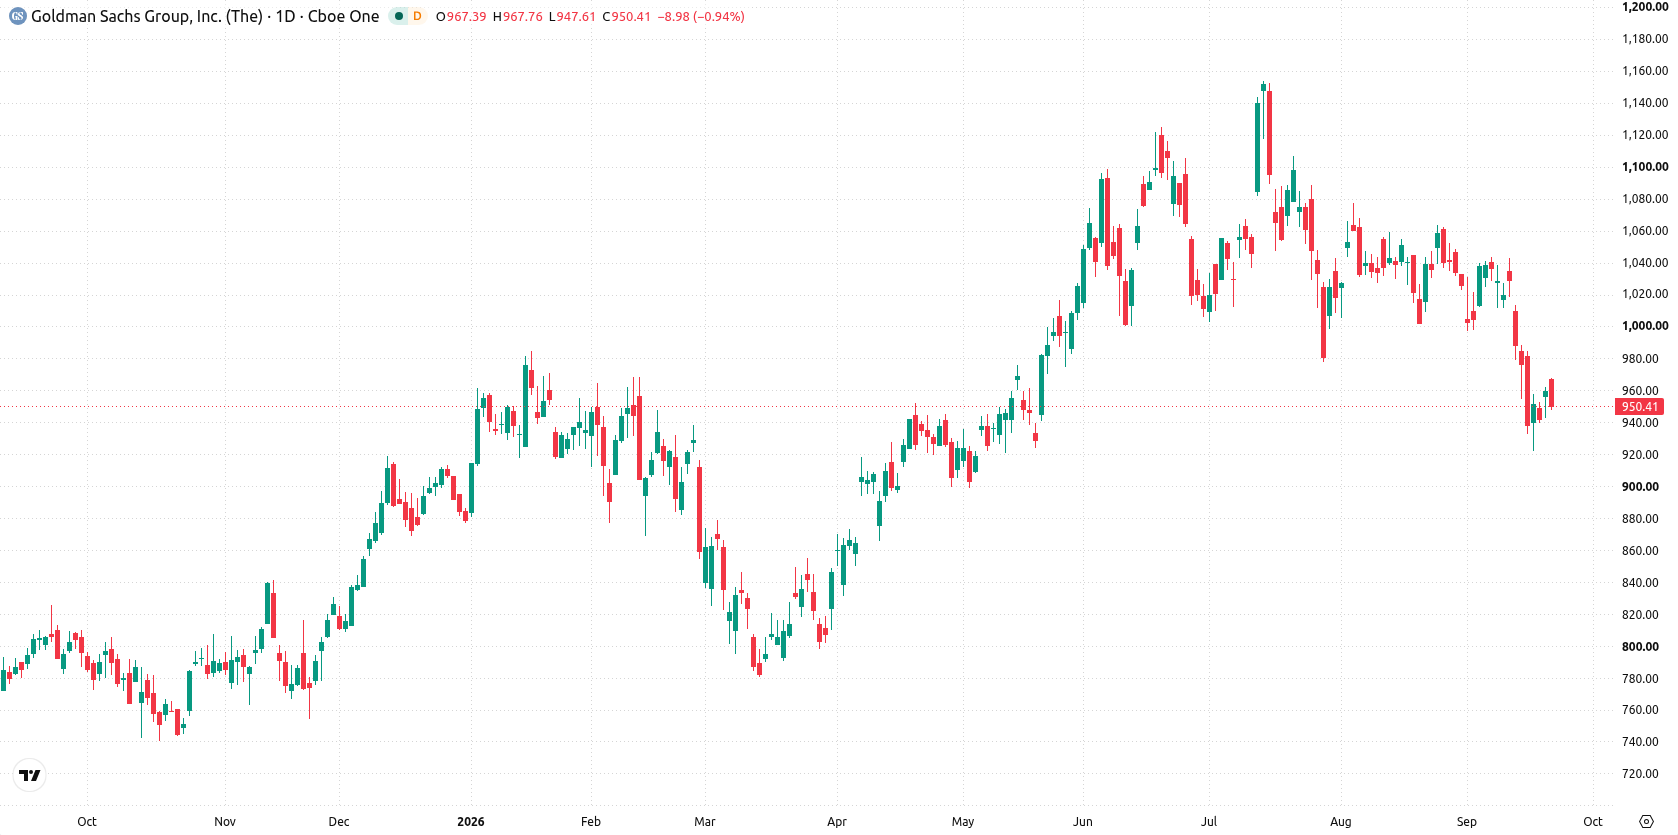
Bearish momentum persists as mixed signals sustain a narrow trading range
The daily chart reflects a flat trend with a contained move within a narrow range, backed by a 6.52% volatility over the past week. Momentum leans bearish, as MACD signals “Sell” at -30.5 and Bull/Bear Power shows an “Oversold” reading of -23.36, though the HMA provides an opposing “Strong Buy” indication. Nearest support is at $923.99, while resistance aligns with both the 200-day average at $957.59 and the Ichimoku Kijun at $993.74. This mixed momentum suggests the stock may remain range-bound over the next several sessions.
Range-bound consolidation seen as breakout risks hinge on key levels
In the week ahead, Goldman Sachs shares are expected to fluctuate between $924.58 and $978.45. There is a 35% probability of an increase and a 65% probability of a decrease. The base case sees the stock consolidating between its immediate support and resistance levels. A bullish breakout above $957.59 could target the upper boundary of the range, while a move below $923.99 would open the way for further downside.
Earlier, analysts noted that Goldman Sachs was exhibiting a neutral-to-bearish technical structure with persistent short- and medium-term resistance. The current setup adds an international investment catalyst to the mix but, given prevailing bearish momentum and mixed signals, traders should watch for a potential downside break below $923.99 as the next key risk.






Latest Goldman Sachs News



-
 Afghanistan
-
 Albania
-
 Algeria
-
 Angola
-
 Argentina
-
 Armenia
-
 Australia
-
 Austria
-
 Azerbaijan
-
 Bahamas
-
 Bahrain
-
 Bangladesh
-
 Belarus
-
 Belgium
-
 Bolivia
-
 Botswana
-
 Brazil
-
 Brunei
-
 Bulgaria
-
 Cambodia
-
 Cameroon
-
 Canada
-
 Chile
-
 China
-
 Colombia
-
 Congo
-
 Costa Rica
-
 Cote d'Ivoire
-
 Croatia
-
 Cuba
-
 Cyprus
-
 Czechia
-
 DR Congo
-
 Denmark
-
 Dominican Republic
-
 Ecuador
-
 Egypt
-
 El Salvador
-
 Estonia
-
 Eswatini
-
 Ethiopia
-
 Finland
-
 France
-
 Georgia
-
 Germany
-
 Ghana
-
 Greece
-
 Haiti
-
 Hong Kong
-
 Hungary
-
 India
-
 Indonesia
-
 Iran, Islamic republic
-
 Iraq
-
 Ireland
-
 Israel
-
 Italy
-
 Jamaica
-
 Japan
-
 Jordan
-
 Kazakhstan
-
 Kenya
-
 Korea
-
 Kuwait
-
 Kyrgyzstan
-
 Laos
-
 Latvia
-
 Lebanon
-
 Lesotho
-
 Libya
-
 Lithuania
-
 Luxembourg
-
 Madagascar
-
 Malaysia
-
 Malta
-
 Mauritius
-
 Mexico
-
 Moldova
-
 Mongolia
-
 Montenegro
-
 Morocco
-
 Mozambique
-
 Myanmar
-
 Namibia
-
 Nepal
-
 Netherlands
-
 New Zealand
-
 Nigeria
-
 North Macedonia
-
 Norway
-
 Oman
-
 Pakistan
-
 Palestine
-
 Panama
-
 Papua New Guinea
-
 Paraguay
-
 Peru
-
 Philippines
-
 Poland
-
 Portugal
-
 Puerto Rico
-
 Qatar
-
 Reunion
-
 Romania
-
 Rwanda
-
 Saudi Arabia
-
 Serbia
-
 Singapore
-
 Slovakia
-
 Slovenia
-
 Somalia
-
 South Africa
-
 Spain
-
 Sri Lanka
-
 Sweden
-
 Switzerland
-
 Syria
-
 Taiwan
-
 Tajikistan
-
 Tanzania
-
 Thailand
-
 Trinidad and Tobago
-
 Tunisia
-
 Turkey
-
 UAE
-
 Uganda
-
 Ukraine
-
 United Kingdom
-
United States
-
 Uruguay
-
 Uzbekistan
-
 Venezuela
-
 Vietnam
-
 Yemen
-
 Zambia
-
 Zimbabwe
- Forex
- Crypto












