

Goldman Sachs stock rises over 2% as investors respond to AI infrastructure push and diversified revenue streams

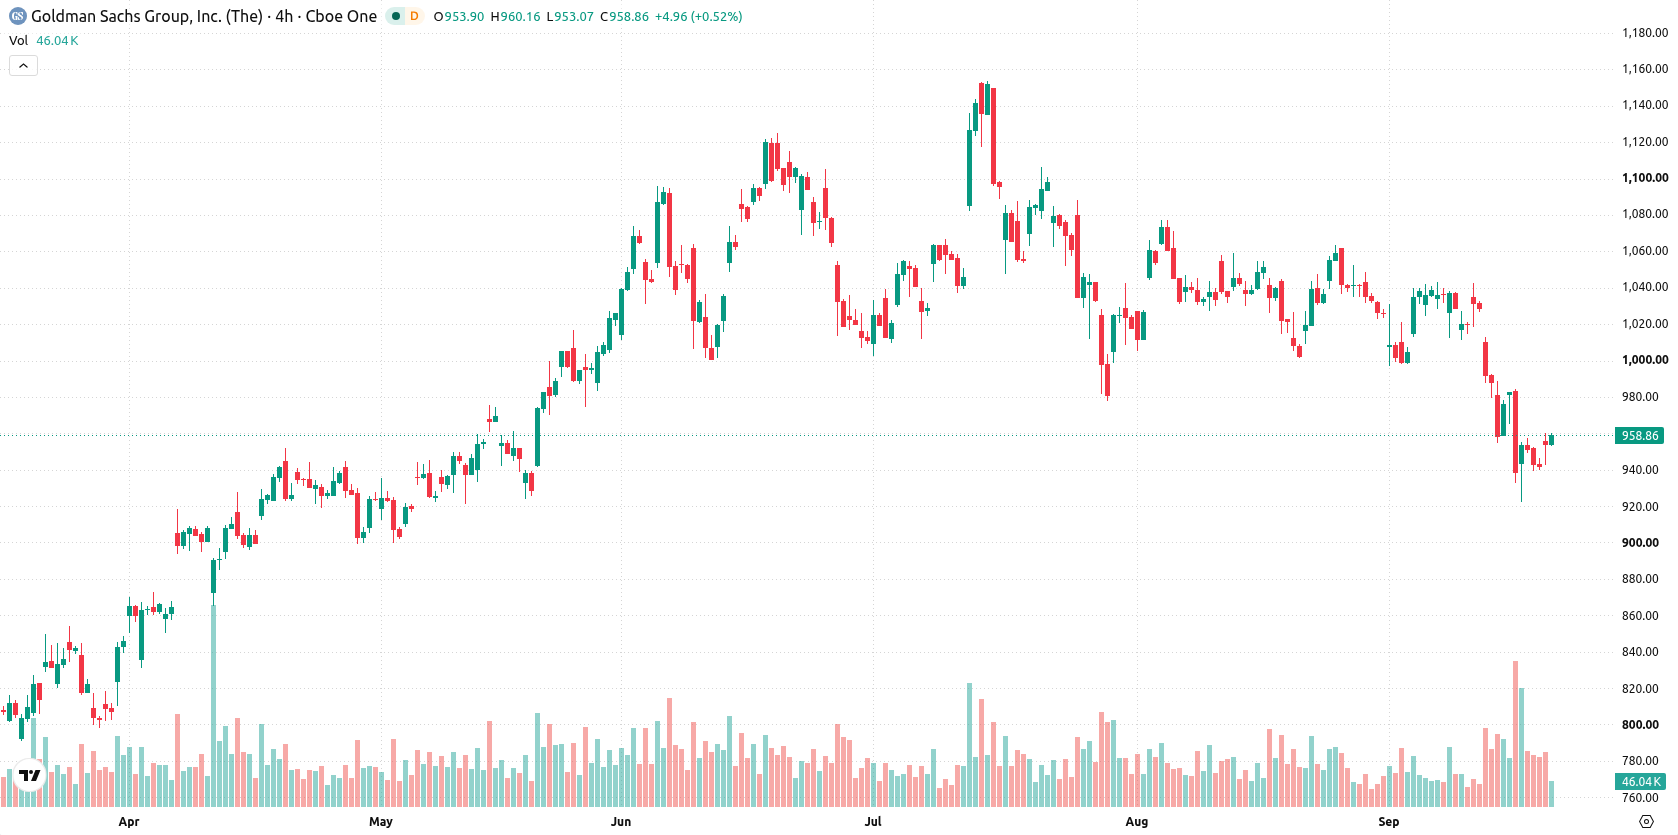
Goldman Sachs Group, Inc. (GS) advanced 2.01% as investors responded to the company's ongoing commitment to AI infrastructure and continued diversification of revenue streams. The move looks limited, with GS trading below its 20-day and 50-day moving averages, pointing to persistent short- and medium-term resistance against a structurally weak technical backdrop.
 896.90
905.44
896.90
905.44
Highlights
- Goldman Sachs projects $1.4 trillion in U.S. hyperscaler investment in artificial intelligence infrastructure by 2027.
- The company maintains a 1.91% dividend yield with a low payout ratio and has business segments in investment banking, asset management, and platform solutions.
- Goldman Sachs stock trades below near-term moving averages with momentum signals indicating weak trend and a high likelihood of a move toward $930.88 to $991.1 in the next five days.
Capital investment and blockchain moves boost sentiment and diversification
Goldman Sachs reported ongoing investment in artificial intelligence infrastructure, highlighting a projected $1.4 trillion in capital commitments by U.S. hyperscalers by 2027. The company maintains a 1.91% dividend yield with a low payout ratio and a diversified business across investment banking, asset management, and platform solutions. GS also participated in the first live trades of tokenized DTC-held stocks, further demonstrating its engagement in blockchain securities markets.
Short-term pressure persists as momentum stays weak and oversold
GS is trading below its 20-day and 50-day moving averages ($1,013 and $1,036), but remains above the 200-day average ($956.87), indicating short- and medium-term selling pressure while long-term support holds. Key resistance is at $984.21 with nearest support at $958.56. Momentum indicators such as MACD and ADX reflect weak momentum and a lack of clear trend. RSI, CCI, and Stochastic RSI all indicate oversold conditions, while BBP remains strongly negative, and the Awesome Oscillator supports prevailing selling pressure. Despite early upside momentum and intraday volatility of 1.57%, underlying technical signals remain negative.
Earlier, analysts noted that Goldman Sachs was exhibiting a neutral-to-bearish technical structure amid persistent macroeconomic headwinds. The latest data confirm continuing short- and medium-term resistance, with a prevailing risk that a break below current support could open the way for range expansion to the downside in the coming week.









-
 Afghanistan
-
 Albania
-
 Algeria
-
 Angola
-
 Argentina
-
 Armenia
-
 Australia
-
 Austria
-
 Azerbaijan
-
 Bahamas
-
 Bahrain
-
 Bangladesh
-
 Belarus
-
 Belgium
-
 Bolivia
-
 Botswana
-
 Brazil
-
 Brunei
-
 Bulgaria
-
 Cambodia
-
 Cameroon
-
 Canada
-
 Chile
Chile
-
 China
China
-
 Colombia
-
 Congo
Congo
-
 Costa Rica
-
 Cote d'Ivoire
-
 Croatia
-
 Cuba
Cuba
-
 Cyprus
-
 Czechia
-
 DR Congo
-
 Denmark
-
 Dominican Republic
-
 Ecuador
-
 Egypt
Egypt
-
 El Salvador
-
 Estonia
-
 Eswatini
-
 Ethiopia
-
 Finland
-
 France
-
 Georgia
-
 Germany
-
 Ghana
Ghana
-
 Greece
-
 Haiti
Haiti
-
 Hong Kong
-
 Hungary
-
 India
India
-
 Indonesia
-
 Iran, Islamic republic
-
 Iraq
Iraq
-
 Ireland
-
 Israel
-
 Italy
Italy
-
 Jamaica
-
 Japan
Japan
-
 Jordan
-
 Kazakhstan
-
 Kenya
Kenya
-
 Korea
Korea
-
 Kuwait
-
 Kyrgyzstan
-
 Laos
Laos
-
 Latvia
-
 Lebanon
-
 Lesotho
-
 Libya
Libya
-
 Lithuania
-
 Luxembourg
-
 Madagascar
-
 Malaysia
-
 Malta
Malta
-
 Mauritius
-
 Mexico
-
 Moldova
-
 Mongolia
-
 Montenegro
-
 Morocco
-
 Mozambique
-
 Myanmar
-
 Namibia
-
 Nepal
Nepal
-
 Netherlands
-
 New Zealand
-
 Nigeria
-
 North Macedonia
-
 Norway
-
 Oman
Oman
-
 Pakistan
-
 Palestine
-
 Panama
-
 Papua New Guinea
-
 Paraguay
-
 Peru
Peru
-
 Philippines
-
 Poland
-
 Portugal
-
 Puerto Rico
-
 Qatar
Qatar
-
 Reunion
-
 Romania
-
 Rwanda
-
 Saudi Arabia
-
 Serbia
-
 Singapore
-
 Slovakia
-
 Slovenia
-
 Somalia
-
 South Africa
-
 Spain
Spain
-
 Sri Lanka
-
 Sweden
-
 Switzerland
-
 Syria
Syria
-
 Taiwan
-
 Tajikistan
-
 Tanzania
-
 Thailand
-
 Trinidad and Tobago
-
 Tunisia
-
 Turkey
-
 UAE
UAE
-
 Uganda
-
 Ukraine
-
 United Kingdom
-
United States
-
 Uruguay
-
 Uzbekistan
-
 Venezuela
-
 Vietnam
-
 Yemen
Yemen
-
 Zambia
-
 Zimbabwe
- Forex
- Crypto












