

Goldman Sachs stock buyers support gains amid mixed technical signals: weekly analysis

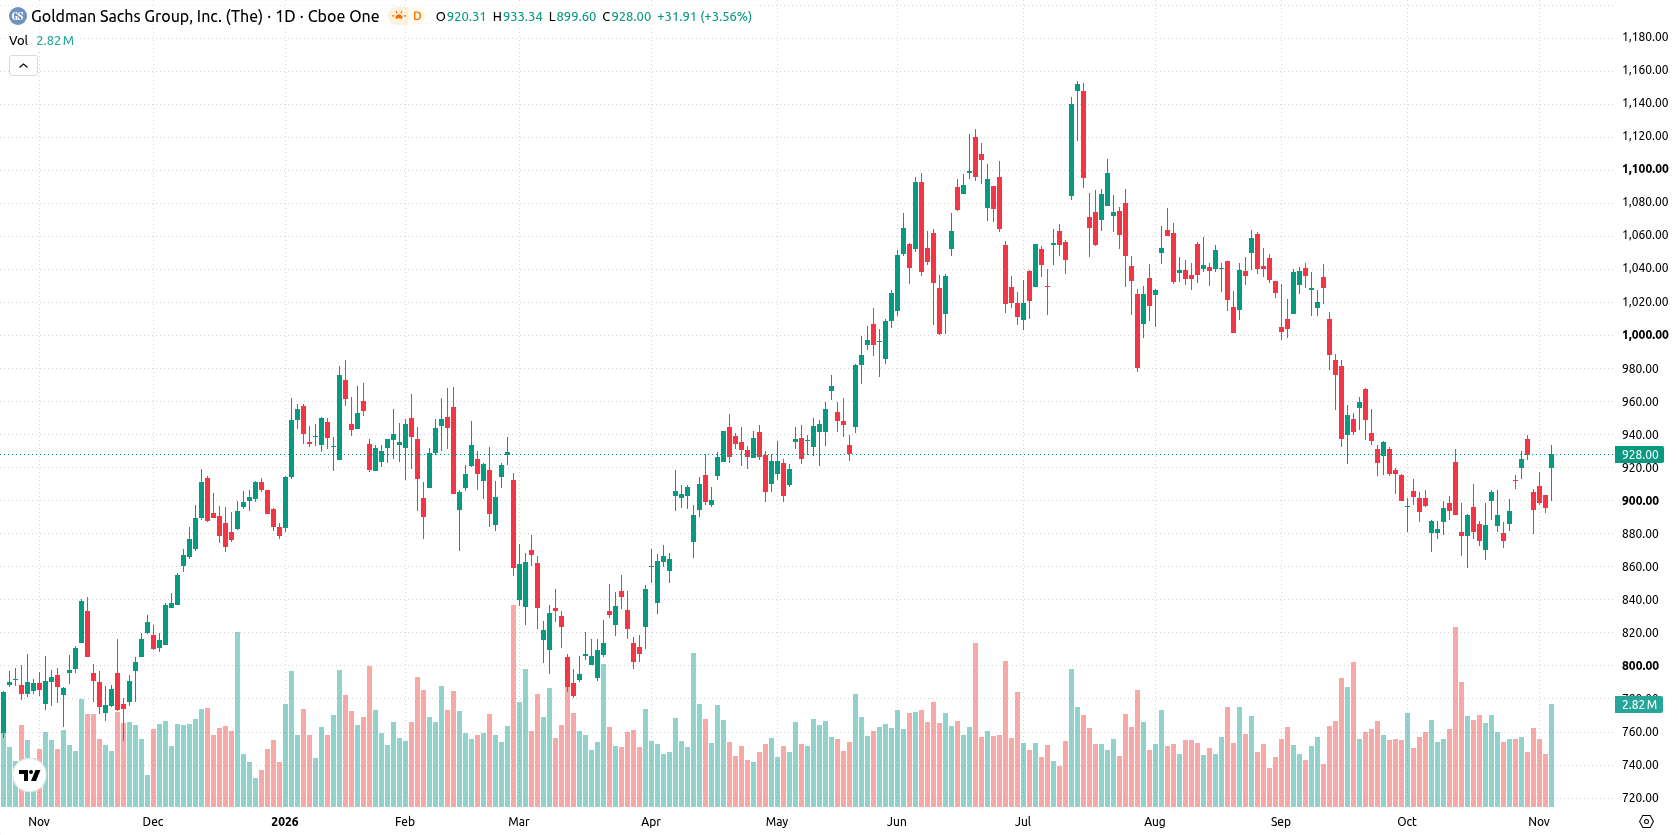
Shares of Goldman Sachs Group, Inc. (GS) are trading near $928, rallying nearly 4% for the week as buyers supported a continued recovery. However, the chart reveals a stretched setup with technical signals split between buying interest and rising risks of a short-term pullback, setting up a cautious tone for the days ahead.
 886.33
932.74
Highlights
- Shares of Goldman Sachs rose 3.78% over the past week to $928.2, remaining below key long-term moving averages.
- The stock is trading near the top of its weekly range and faces resistance at $939.28, with support at $899.5.
- Technical indicators show mixed momentum and overbought conditions, with Goldman Sachs shares expected to fluctuate between $901.54 and $954.85 next week.
Revenue surge and mixed flows as institutional sentiment diverges
Goldman Sachs reported third-quarter 2026 revenue of $18.68 billion, up 23% year over year, and net income attributed to common shareholders of $5.12 billion, a 33% increase, with stronger Global Banking & Markets performance highlighted in its latest 10-Q filing according to TradingView. On October 29, 2026, 34 ETFs — including the SPDR Dow Jones Industrial Average ETF Trust — added to their GS holdings, while DIA itself purchased $13.8 million in GS shares, Yahoo Finance reported. Meanwhile, institutional investors such as ProShare Advisors LLC, IPG Investment Advisors LLC, and Kelleher Financial Advisors reduced their positions in GS during the same period (sources: MarketBeat, MarketBeat, MarketBeat).
Overbought signals emerge as price tests resistance and trend indicators diverge
On the daily chart, the setup is characterized by the price near the top of its weekly range and approaching the nearest resistance at $939.28. Momentum signals are mixed: the Stochastic RSI is overbought at 99.81, raising the risk of short-term cooling or downside correction, while other oscillators such as RSI remain neutral. MACD points to a strong sell bias but ADX suggests emerging buying interest, underscoring a clear divergence within trend signals. Weekly volatility stands at 6.78%, and the move displays the characteristics of an emerging move higher that is not yet confirmed.
Balanced range expected with breakout risk near key resistance next week
Over the coming trading week, Goldman Sachs shares are expected to fluctuate between $901.54 and $954.85. Probabilities are nearly balanced, with a 48% chance of an increase and a 52% chance of a decrease. The base case sees the stock moving within this range, consolidating gains above support at $899.5. A bullish breakout above $939.28 could open the way for a run towards the upper end of the range, while a reversal below $899.5 would likely lead to further downside pressure.
Previously it was reported that Goldman Sachs was actively syndicating a major AI infrastructure financing deal for SpaceX alongside Apollo Global Management. The current technical landscape in GS shares now introduces a potential inflection point, making the $939.28 resistance a key technical level to monitor for confirmation of sustained upward momentum.






Latest Goldman Sachs News




-
 Afghanistan
-
 Albania
-
 Algeria
-
 Angola
-
 Argentina
-
 Armenia
-
 Australia
-
 Austria
-
 Azerbaijan
-
 Bahamas
-
 Bahrain
-
 Bangladesh
-
 Belarus
-
 Belgium
-
 Bolivia
-
 Botswana
-
 Brazil
-
 Brunei
-
 Bulgaria
-
 Cambodia
-
 Cameroon
-
 Canada
-
 Chile
-
 China
-
 Colombia
-
 Congo
-
 Costa Rica
-
 Cote d'Ivoire
-
 Croatia
-
 Cuba
-
 Cyprus
-
 Czechia
-
 DR Congo
-
 Denmark
-
 Dominican Republic
-
 Ecuador
-
 Egypt
-
 El Salvador
-
 Estonia
-
 Eswatini
-
 Ethiopia
-
 Finland
-
 France
-
 Georgia
-
 Germany
-
 Ghana
-
 Greece
-
 Haiti
-
 Hong Kong
-
 Hungary
-
 India
-
 Indonesia
-
 Iran, Islamic republic
-
 Iraq
-
 Ireland
-
 Israel
-
 Italy
-
 Jamaica
-
 Japan
-
 Jordan
-
 Kazakhstan
-
 Kenya
-
 Korea
-
 Kuwait
-
 Kyrgyzstan
-
 Laos
-
 Latvia
-
 Lebanon
-
 Lesotho
-
 Libya
-
 Lithuania
-
 Luxembourg
-
 Madagascar
-
 Malaysia
-
 Malta
-
 Mauritius
-
 Mexico
-
 Moldova
-
 Mongolia
-
 Montenegro
-
 Morocco
-
 Mozambique
-
 Myanmar
-
 Namibia
-
 Nepal
-
 Netherlands
-
 New Zealand
-
 Nigeria
-
 North Macedonia
-
 Norway
-
 Oman
-
 Pakistan
-
 Palestine
-
 Panama
-
 Papua New Guinea
-
 Paraguay
-
 Peru
-
 Philippines
-
 Poland
-
 Portugal
-
 Puerto Rico
-
 Qatar
-
 Reunion
-
 Romania
-
 Rwanda
-
 Saudi Arabia
-
 Serbia
-
 Singapore
-
 Slovakia
-
 Slovenia
-
 Somalia
-
 South Africa
-
 Spain
-
 Sri Lanka
-
 Sweden
-
 Switzerland
-
 Syria
-
 Taiwan
-
 Tajikistan
-
 Tanzania
-
 Thailand
-
 Trinidad and Tobago
-
 Tunisia
-
 Turkey
-
 UAE
-
 Uganda
-
 Ukraine
-
 United Kingdom
-
United States
-
 Uruguay
-
 Uzbekistan
-
 Venezuela
-
 Vietnam
-
 Yemen
-
 Zambia
-
 Zimbabwe
- Forex
- Crypto












