

Nvidia stock breakout attempt at $242.05 resistance: Key levels to watch

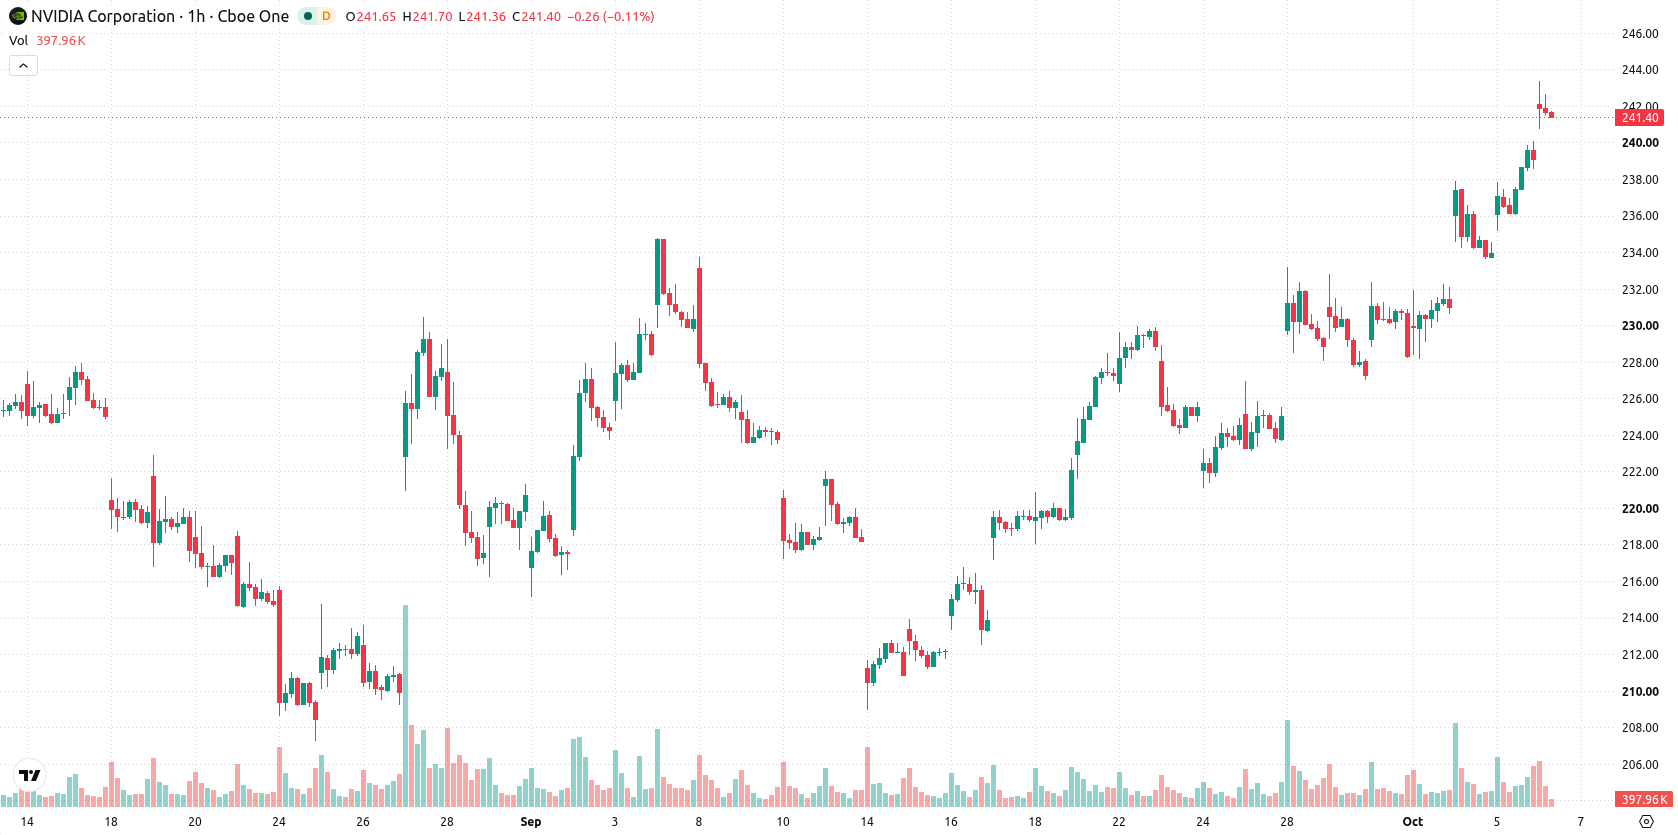
Nvidia (NVDA) stock is trading at $241.66, up 1.23% on the day. The price is positioned above its key moving averages, consolidating near the session high in a period of moderate volatility.
 143.73
163.00
Highlights
- Nvidia executed a $20 billion share buyback, increasing capital returned to shareholders and improving per-share metrics.
- Nvidia announced a $20 billion acquisition of Groq and formally acquired Hugging Face for $12.9 billion, expanding its AI and language model capabilities.
- Nvidia stock closed at $241.66 and maintained a strong bullish trend, with price expected to trade in the $236.41 to $246.91 range in the next 2 to 3 days.
Shareholder returns and AI expansion accelerate on buybacks and acquisitions
Nvidia's execution of a $20 billion share buyback, as highlighted by Fool, has directly increased capital returned to shareholders and reduced the outstanding share float, supporting upward movement in the stock by improving per-share metrics. The company has also announced a $20 billion acquisition of AI chip startup Groq, currently under legal and regulatory examination, which underscores Nvidia’s intent to expand into new areas of artificial intelligence, according to Gurufocus. Additionally, Nvidia’s formal $12.9 billion acquisition of Hugging Face, reported by Morningstar, strengthens its position in large language model infrastructure and broadens its reach within AI-driven markets.
Momentum remains strong as technicals confirm bullish, overbought state
On the technical front, NVDA/USD remains above the MA-20 and MA-50 levels on the H1 timeframe, as well as above the MA-200 on the daily chart. The Ichimoku Kijun at $234.15 serves as key immediate support. Both MACD and ADX signal ongoing buying momentum, while RSI at 67.91, Stoch RSI, CCI, and Bull/Bear Power all indicate overbought conditions, reflecting continued buyer dominance in intraday trading. The Awesome Oscillator is also supportive of the current upward trend, with no significant divergence across these indicators.
Bullish outlook prevails as tight range hints at upside breakout
Over the next 2–3 trading days, NVDA/USD is expected to move within a $236.41 to $246.91 range. The likelihood of an upward price move is assessed as very high, while the probability of a downside break is very low. The baseline case anticipates sideways movement within this volatility band. Should resistance be cleared decisively, a bullish extension is likely, whereas a break below immediate support could prompt further declines.
Earlier, analysts noted that gains in key AI-related stocks such as Nvidia have supported headline strength in the S&P 500 even as broader market sectors faced pressure from rising yields. In light of Nvidia’s recent capital return activities and strategic acquisitions in the AI domain, traders should monitor $234.15 as a key support level over the coming sessions amid persistence of overbought technical conditions.






Latest NVIDIA News





-
 Afghanistan
-
 Albania
-
 Algeria
-
 Angola
-
 Argentina
-
 Armenia
-
 Australia
-
 Austria
-
 Azerbaijan
-
 Bahamas
-
 Bahrain
-
 Bangladesh
-
 Belarus
-
 Belgium
-
 Bolivia
-
 Botswana
-
 Brazil
-
 Brunei
-
 Bulgaria
-
 Cambodia
-
 Cameroon
-
 Canada
-
 Chile
-
 China
-
 Colombia
-
 Congo
-
 Costa Rica
-
 Cote d'Ivoire
-
 Croatia
-
 Cuba
-
 Cyprus
-
 Czechia
-
 DR Congo
-
 Denmark
-
 Dominican Republic
-
 Ecuador
-
 Egypt
-
 El Salvador
-
 Estonia
-
 Eswatini
-
 Ethiopia
-
 Finland
-
 France
-
 Georgia
-
 Germany
-
 Ghana
-
 Greece
-
 Haiti
-
 Hong Kong
-
 Hungary
-
 India
-
 Indonesia
-
 Iran, Islamic republic
-
 Iraq
-
 Ireland
-
 Israel
-
 Italy
-
 Jamaica
-
 Japan
-
 Jordan
-
 Kazakhstan
-
 Kenya
-
 Korea
-
 Kuwait
-
 Kyrgyzstan
-
 Laos
-
 Latvia
-
 Lebanon
-
 Lesotho
-
 Libya
-
 Lithuania
-
 Luxembourg
-
 Madagascar
-
 Malaysia
-
 Malta
-
 Mauritius
-
 Mexico
-
 Moldova
-
 Mongolia
-
 Montenegro
-
 Morocco
-
 Mozambique
-
 Myanmar
-
 Namibia
-
 Nepal
-
 Netherlands
-
 New Zealand
-
 Nigeria
-
 North Macedonia
-
 Norway
-
 Oman
-
 Pakistan
-
 Palestine
-
 Panama
-
 Papua New Guinea
-
 Paraguay
-
 Peru
-
 Philippines
-
 Poland
-
 Portugal
-
 Puerto Rico
-
 Qatar
-
 Reunion
-
 Romania
-
 Rwanda
-
 Saudi Arabia
-
 Serbia
-
 Singapore
-
 Slovakia
-
 Slovenia
-
 Somalia
-
 South Africa
-
 Spain
-
 Sri Lanka
-
 Sweden
-
 Switzerland
-
 Syria
-
 Taiwan
-
 Tajikistan
-
 Tanzania
-
 Thailand
-
 Trinidad and Tobago
-
 Tunisia
-
 Turkey
-
 UAE
-
 Uganda
-
 Ukraine
-
 United Kingdom
-
United States
-
 Uruguay
-
 Uzbekistan
-
 Venezuela
-
 Vietnam
-
 Yemen
-
 Zambia
-
 Zimbabwe
- Forex
- Crypto












