

Lennar stock breakout attempt at $78.97 resistance: Technical outlook

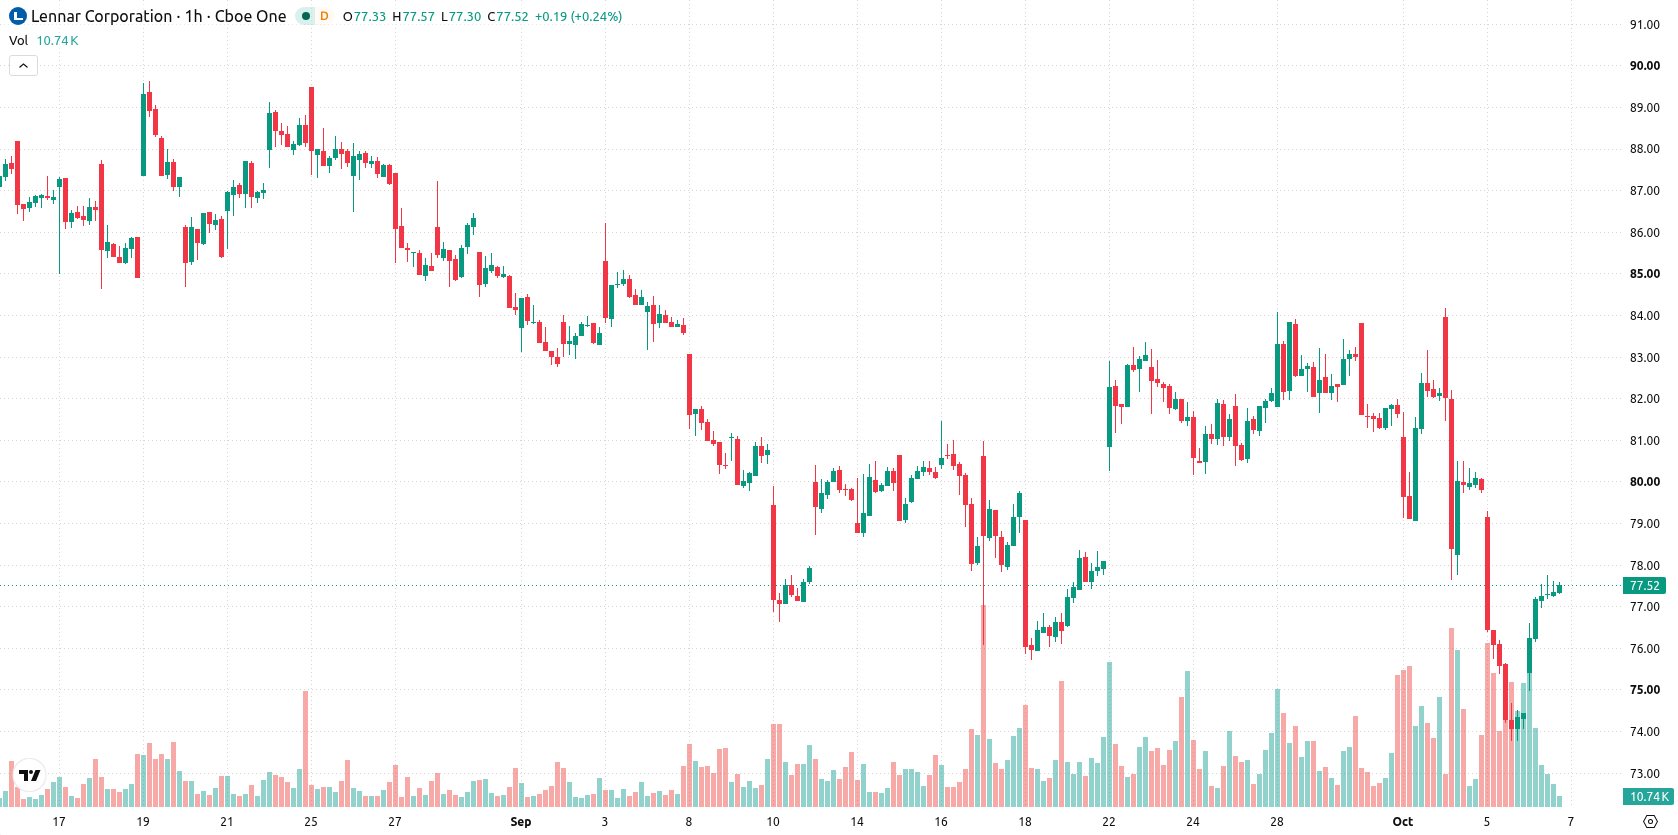
Lennar (LEN) stock is trading at $77.41, up 3.98% for the day. The price sits below its short- and medium-term moving averages, indicating it remains under pressure compared to recent trends.
 89.97
91.74
Highlights
- Berkshire Hathaway raised its stake in Lennar above 10% with a $193 million purchase, increasing institutional demand and lowering available float.
- Lennar missed expectations on quarterly adjusted earnings and revenue, with a reported decline in new orders and expanding regulatory scrutiny.
- LEN/USD trades below key moving averages with persistent selling pressure and momentum indicators mostly negative; the expected trading range is $72.89 to $81.93.
Berkshire stake rise and mixed results fuel institutional demand and scrutiny
Berkshire Hathaway has increased its stake in Lennar with a $193 million purchase of additional shares on October 1 and October 2, 2026, taking its ownership to over 10% and introducing substantial institutional demand, according to 247wallst. This surge in high-profile buying acts as a direct catalyst for fresh investor interest and reduces available float. At the same time, Lennar's most recent quarterly results showed adjusted earnings and revenue below expectations along with declining new orders, as noted by Investing.com. Regulatory scrutiny has also intensified, with Block & Leviton launching an investigation into the company's reported home deliveries following questions about purchases from Millrose Properties, as reported by Supplychaindigital.
Mixed momentum as price nears resistance despite oversold technicals
Technical levels show LEN trading below the MA-20 at $78.14, MA-50 at $80.45, and well under the MA-200 at $94.05 on the hourly chart. Immediate resistance is identified at the Ichimoku Kijun level of $78.97. Momentum indicators present mixed signals: MACD is at strong sell, ADX signals a sell bias, and RSI stands at 46.72, leaning toward a sell condition. Stochastic RSI and Bull/Bear Power show overbought readings that highlight recent bullish attempts, while CCI and the Awesome Oscillator are neutral. Volatility is elevated, with the price moving near today's high despite prevalent weak momentum, illustrating a clear divergence between technical oscillators and recent price action.
Range-bound outlook as downside risk outweighs upside momentum
In the short term, LEN is expected to trade between $72.89 and $81.93 as a typical volatility band relative to current levels. The probability model suggests a 33% chance of further gains, compared to 67% odds of a decline. The baseline scenario anticipates sideways movement within this range, while a bullish scenario requires a decisive break above the nearest resistance, and a bearish scenario unfolds if price action falls below the $72.89 support.
Previously it was reported that Lennar continued to face downside risks amid weak earnings and challenging technical conditions. The current analysis adds heightened regulatory scrutiny and persistent mixed momentum signals, positioning the $72.89 support as a key level for traders to monitor in the event of renewed bearish pressure.









-
 Afghanistan
-
 Albania
-
 Algeria
-
 Angola
-
 Argentina
-
 Armenia
-
 Australia
-
 Austria
-
 Azerbaijan
-
 Bahamas
-
 Bahrain
-
 Bangladesh
-
 Belarus
-
 Belgium
-
 Bolivia
-
 Botswana
-
 Brazil
-
 Brunei
-
 Bulgaria
-
 Cambodia
-
 Cameroon
-
 Canada
-
 Chile
-
 China
-
 Colombia
-
 Congo
-
 Costa Rica
-
 Cote d'Ivoire
-
 Croatia
-
 Cuba
-
 Cyprus
-
 Czechia
-
 DR Congo
-
 Denmark
-
 Dominican Republic
-
 Ecuador
-
 Egypt
-
 El Salvador
-
 Estonia
-
 Eswatini
-
 Ethiopia
-
 Finland
-
 France
-
 Georgia
-
 Germany
-
 Ghana
-
 Greece
-
 Haiti
-
 Hong Kong
-
 Hungary
-
 India
-
 Indonesia
-
 Iran, Islamic republic
-
 Iraq
-
 Ireland
-
 Israel
-
 Italy
-
 Jamaica
-
 Japan
-
 Jordan
-
 Kazakhstan
-
 Kenya
-
 Korea
-
 Kuwait
-
 Kyrgyzstan
-
 Laos
-
 Latvia
-
 Lebanon
-
 Lesotho
-
 Libya
-
 Lithuania
-
 Luxembourg
-
 Madagascar
-
 Malaysia
-
 Malta
-
 Mauritius
-
 Mexico
-
 Moldova
-
 Mongolia
-
 Montenegro
-
 Morocco
-
 Mozambique
-
 Myanmar
-
 Namibia
-
 Nepal
-
 Netherlands
-
 New Zealand
-
 Nigeria
-
 North Macedonia
-
 Norway
-
 Oman
-
 Pakistan
-
 Palestine
-
 Panama
-
 Papua New Guinea
-
 Paraguay
-
 Peru
-
 Philippines
-
 Poland
-
 Portugal
-
 Puerto Rico
-
 Qatar
-
 Reunion
-
 Romania
-
 Rwanda
-
 Saudi Arabia
-
 Serbia
-
 Singapore
-
 Slovakia
-
 Slovenia
-
 Somalia
-
 South Africa
-
 Spain
-
 Sri Lanka
-
 Sweden
-
 Switzerland
-
 Syria
-
 Taiwan
-
 Tajikistan
-
 Tanzania
-
 Thailand
-
 Trinidad and Tobago
-
 Tunisia
-
 Turkey
-
 UAE
-
 Uganda
-
 Ukraine
-
 United Kingdom
-
United States
-
 Uruguay
-
 Uzbekistan
-
 Venezuela
-
 Vietnam
-
 Yemen
-
 Zambia
-
 Zimbabwe
- Forex
- Crypto












