


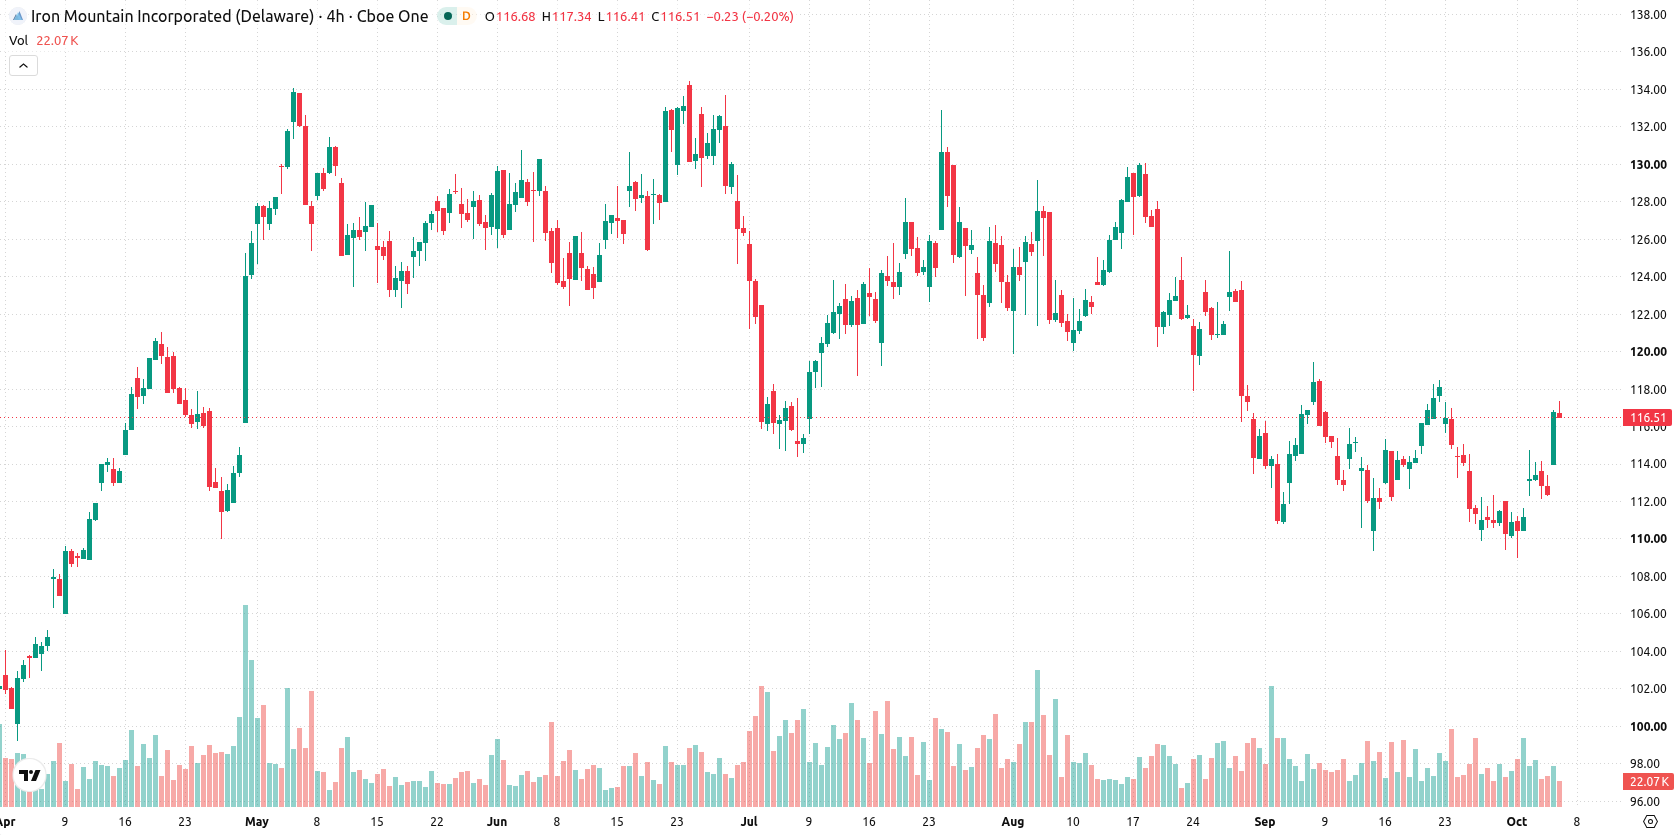
Iron Mountain Incorporated (IRM) surged 3.41% today in a swift advance driven by robust technical momentum and a decisive upside gap. The strength of the move is supported by the stock’s position above both its 20- and 200-day moving averages, though medium-term resistance just overhead presents a near-term hurdle.
 118.13
119.58
Highlights
- Iron Mountain stock advanced 3.41% intraday to a session high near $117.31 amid elevated price volatility of 2.94%.
- Technical indicator signals are mixed, with short- and long-term bullish structure but ongoing medium-term resistance, overbought intraday status, and persistent selling pressure.
- The expected five-day trading range is $113.38 to $120.83, with a very high probability of a downward move and baseline scenario of sideways consolidation.
Mixed momentum signals as resistance limits post-gap strength
Iron Mountain is trading above its 20-day moving average ($113.49) and 200-day moving average ($112.43), but remains below its 50-day moving average ($118.7). This positioning signals short- and long-term strength for the stock, with some medium-term resistance still in play. The nearest support is at $116.03 (Ichimoku Kijun), while immediate resistance lies at $117.31, which was also today’s high. Momentum indicators are mixed: the MACD points to strong selling pressure, the ADX remains neutral, RSI reads mildly weak at 43.49 with a "Sell" outlook, and both the CCI and Stochastic RSI confirm a neutral stance. Bull/Bear Power (BBP) at 1.13 reflects intraday buyer dominance but also highlights an overbought signal. Today's gain of $3.83 or 3.41% came after a significant upside gap and near the session's range top, showing strong intraday momentum even as bearish and overbought signals diverge in the short term.
Earlier, analysts noted that Iron Mountain was exhibiting short- and medium-term technical weakness despite longer-term trend support. The latest surge and gap higher reflects a shift in momentum, but with a high likelihood of near-term consolidation or pullback, traders should closely watch the $116.03-$117.31 band for directional cues.










-
 Afghanistan
-
 Albania
-
 Algeria
-
 Angola
-
 Argentina
-
 Armenia
-
 Australia
-
 Austria
-
 Azerbaijan
-
 Bahamas
-
 Bahrain
-
 Bangladesh
-
 Belarus
-
 Belgium
-
 Bolivia
-
 Botswana
-
 Brazil
-
 Brunei
-
 Bulgaria
-
 Cambodia
-
 Cameroon
-
 Canada
-
 Chile
-
 China
-
 Colombia
-
 Congo
-
 Costa Rica
-
 Cote d'Ivoire
-
 Croatia
-
 Cuba
-
 Cyprus
-
 Czechia
-
 DR Congo
-
 Denmark
-
 Dominican Republic
-
 Ecuador
-
 Egypt
-
 El Salvador
-
 Estonia
-
 Eswatini
-
 Ethiopia
-
 Finland
-
 France
-
 Georgia
-
 Germany
-
 Ghana
-
 Greece
-
 Haiti
-
 Hong Kong
-
 Hungary
-
 India
-
 Indonesia
-
 Iran, Islamic republic
-
 Iraq
-
 Ireland
-
 Israel
-
 Italy
-
 Jamaica
-
 Japan
-
 Jordan
-
 Kazakhstan
-
 Kenya
-
 Korea
-
 Kuwait
-
 Kyrgyzstan
-
 Laos
-
 Latvia
-
 Lebanon
-
 Lesotho
-
 Libya
-
 Lithuania
-
 Luxembourg
-
 Madagascar
-
 Malaysia
-
 Malta
-
 Mauritius
-
 Mexico
-
 Moldova
-
 Mongolia
-
 Montenegro
-
 Morocco
-
 Mozambique
-
 Myanmar
-
 Namibia
-
 Nepal
-
 Netherlands
-
 New Zealand
-
 Nigeria
-
 North Macedonia
-
 Norway
-
 Oman
-
 Pakistan
-
 Palestine
-
 Panama
-
 Papua New Guinea
-
 Paraguay
-
 Peru
-
 Philippines
-
 Poland
-
 Portugal
-
 Puerto Rico
-
 Qatar
-
 Reunion
-
 Romania
-
 Rwanda
-
 Saudi Arabia
-
 Serbia
-
 Singapore
-
 Slovakia
-
 Slovenia
-
 Somalia
-
 South Africa
-
 Spain
-
 Sri Lanka
-
 Sweden
-
 Switzerland
-
 Syria
-
 Taiwan
-
 Tajikistan
-
 Tanzania
-
 Thailand
-
 Trinidad and Tobago
-
 Tunisia
-
 Turkey
-
 UAE
-
 Uganda
-
 Ukraine
-
 United Kingdom
-
United States
-
 Uruguay
-
 Uzbekistan
-
 Venezuela
-
 Vietnam
-
 Yemen
-
 Zambia
-
 Zimbabwe
- Forex
- Crypto












