

ARM trades flat as buyers maintain slight advantage over sellers

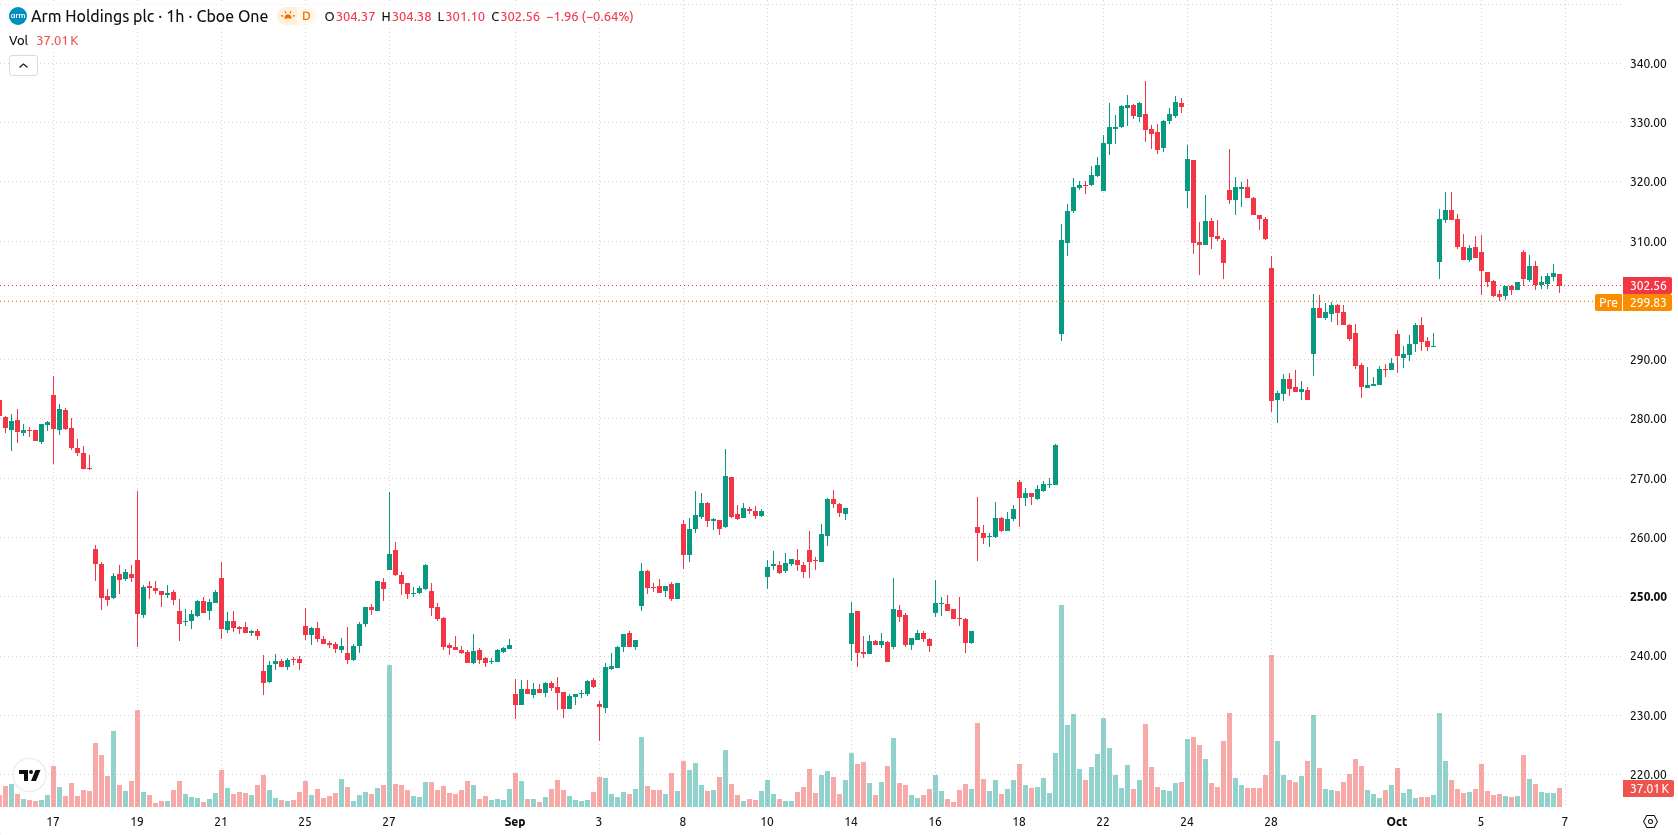
Arm Holdings (ARM) stock is trading at $302.56 after a marginal intraday decline. The current level sits below its main short-term averages but remains above its medium- and long-term trend markers.
 181.55
207.31
Highlights
- ARM/USD trades below its 20-period moving average but holds above the 50- and 200-period averages, maintaining a long-term bullish structure.
- Technical indicator signals are mixed, with momentum split between strong buy and oversold conditions, and trend strength uncertain.
- ARM/USD is projected to remain rangebound between $287.31 to $317.81 in the coming sessions, with a 53% probability of an upward move.
Conflicting momentum as price straddles key support-resistance levels
On the h1 chart, ARM is trading below the MA-20 at $305.25, but remains above the MA-50 at $297.22 and well above the longer-term MA-200 at $217.63. The Ichimoku Kijun line at $304.07 represents immediate resistance on the current setup. Momentum indicators are mixed: MACD signals a Strong Buy, ADX is Neutral, RSI is around 50 suggesting mild buying, while Stochastic RSI is Oversold. CCI indicates a Sell and Bull/Bear Power points to overbought conditions, highlighting ongoing buyer dominance. Awesome Oscillator registers Neutral with no clear direction.
Rangebound outlook as buyers and sellers maintain narrow balance
In the short term, ARM is likely to trade within a band of $287.31 to $317.81, reflecting typical volatility. Projection models suggest buyers hold a slight edge with a 53% probability of an upward move versus 47% for a downward scenario. As baseline, a rangebound pattern is expected as both sides balance out. An upside break above the $304.07 resistance could trigger further gains, while a fall below the $297–$287.31 support zone could result in additional short-term weakness.
Previously it was reported that analysts expected Arm Holdings shares to consolidate as operational uncertainty from ongoing legal proceedings remained a factor. The current analysis adds a nuanced view with mixed technical signals and suggests traders should closely monitor the $304.07 resistance and the $297–$287.31 support zone for directional cues.











-
 Afghanistan
-
 Albania
-
 Algeria
-
 Angola
-
 Argentina
-
 Armenia
-
 Australia
-
 Austria
-
 Azerbaijan
-
 Bahamas
-
 Bahrain
-
 Bangladesh
-
 Belarus
-
 Belgium
-
 Bolivia
-
 Botswana
-
 Brazil
-
 Brunei
-
 Bulgaria
-
 Cambodia
-
 Cameroon
-
 Canada
-
 Chile
-
 China
-
 Colombia
-
 Congo
-
 Costa Rica
-
 Cote d'Ivoire
-
 Croatia
-
 Cuba
-
 Cyprus
-
 Czechia
-
 DR Congo
-
 Denmark
-
 Dominican Republic
-
 Ecuador
-
 Egypt
-
 El Salvador
-
 Estonia
-
 Eswatini
-
 Ethiopia
-
 Finland
-
 France
-
 Georgia
-
 Germany
-
 Ghana
-
 Greece
-
 Haiti
-
 Hong Kong
-
 Hungary
-
 India
-
 Indonesia
-
 Iran, Islamic republic
-
 Iraq
-
 Ireland
-
 Israel
-
 Italy
-
 Jamaica
-
 Japan
-
 Jordan
-
 Kazakhstan
-
 Kenya
-
 Korea
-
 Kuwait
-
 Kyrgyzstan
-
 Laos
-
 Latvia
-
 Lebanon
-
 Lesotho
-
 Libya
-
 Lithuania
-
 Luxembourg
-
 Madagascar
-
 Malaysia
-
 Malta
-
 Mauritius
-
 Mexico
-
 Moldova
-
 Mongolia
-
 Montenegro
-
 Morocco
-
 Mozambique
-
 Myanmar
-
 Namibia
-
 Nepal
-
 Netherlands
-
 New Zealand
-
 Nigeria
-
 North Macedonia
-
 Norway
-
 Oman
-
 Pakistan
-
 Palestine
-
 Panama
-
 Papua New Guinea
-
 Paraguay
-
 Peru
-
 Philippines
-
 Poland
-
 Portugal
-
 Puerto Rico
-
 Qatar
-
 Reunion
-
 Romania
-
 Rwanda
-
 Saudi Arabia
-
 Serbia
-
 Singapore
-
 Slovakia
-
 Slovenia
-
 Somalia
-
 South Africa
-
 Spain
-
 Sri Lanka
-
 Sweden
-
 Switzerland
-
 Syria
-
 Taiwan
-
 Tajikistan
-
 Tanzania
-
 Thailand
-
 Trinidad and Tobago
-
 Tunisia
-
 Turkey
-
 UAE
-
 Uganda
-
 Ukraine
-
 United Kingdom
-
United States
-
 Uruguay
-
 Uzbekistan
-
 Venezuela
-
 Vietnam
-
 Yemen
-
 Zambia
-
 Zimbabwe
- Forex
- Crypto












