

National Grid stock support test: Technical outlook

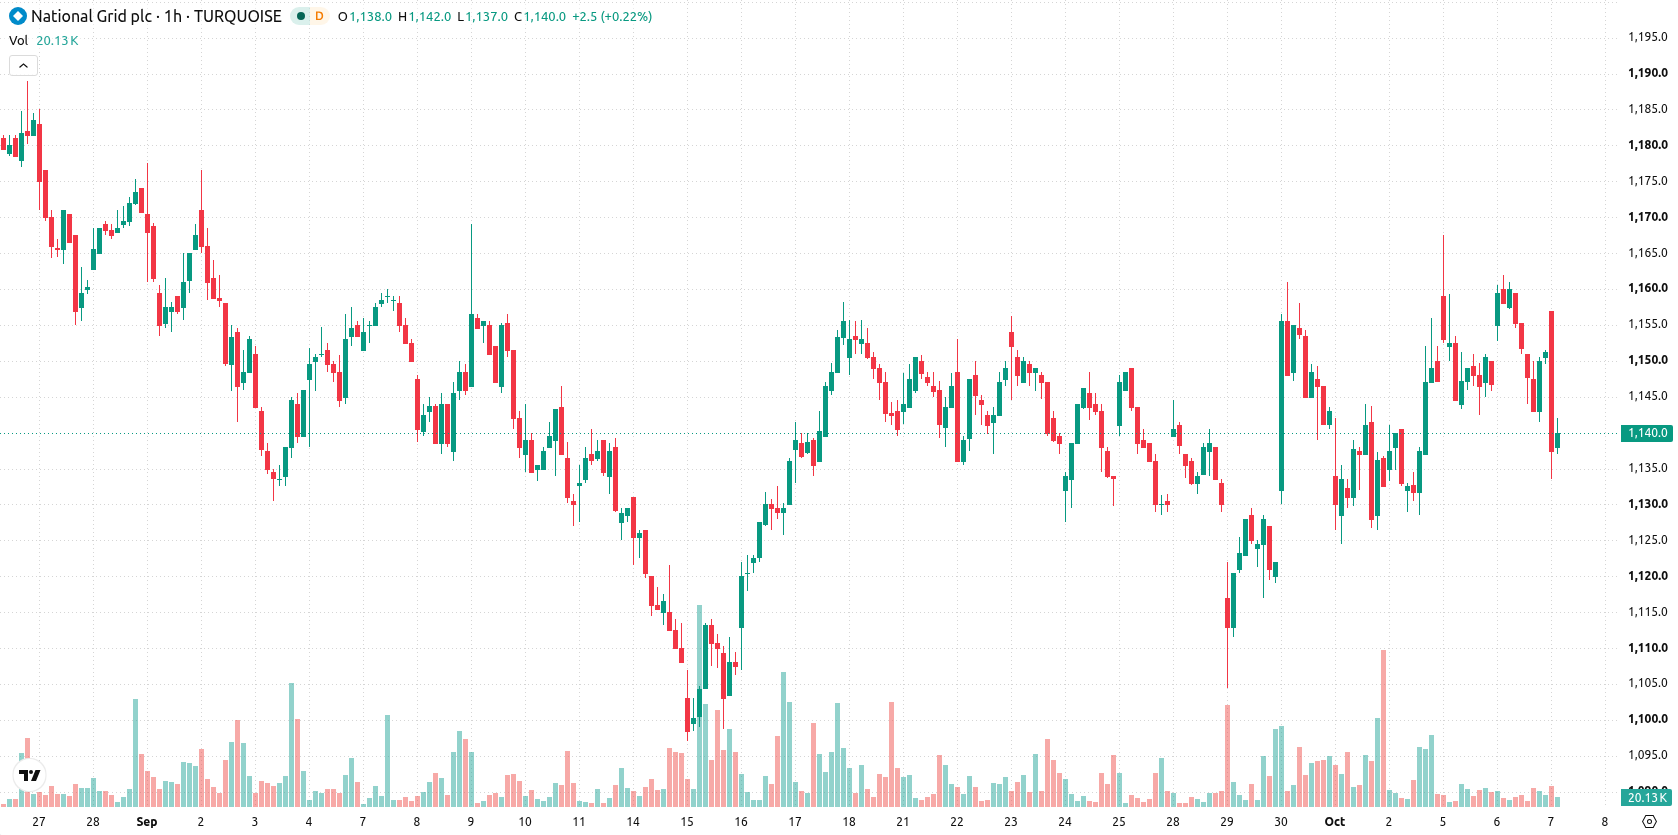
National Grid (NG) stock is trading at GBX1,138.50, down 1.09% for the day. The shares currently sit below their key moving averages, highlighting a sustained phase of weakness in the broader technical context.
 1284.50
Highlights
- National Grid stock trades below key short and long-term moving averages, indicating ongoing pressure from sellers.
- Momentum indicators are mixed, with MACD showing buy pressure but multiple oscillators in oversold territory or pointing to a sell signal.
- Shares closed at GBX1,138, down 1.09%, with a projected trading range of GBX1,119 to GBX1,157 and a 71% probability of further downside.
Divergence between buyer pressure and oversold indicators shapes outlook
On the hourly chart, the price remains below both the MA-20 at GBX1,149 and MA-50 at GBX1,142, and also trades under the long-term MA-200 at GBX1,234 on the daily timeframe. The Ichimoku Kijun at GBX1,148 serves as immediate resistance. Among momentum indicators, MACD signals strong buy pressure, while ADX is neutral and RSI registers a sell reading at 41.14. Both the Stoch RSI and CCI are oversold, and Bull/Bear Power is overbought, indicating buyer dominance intraday that diverges from the more cautious signals of oscillators. The Awesome Oscillator remains neutral. Notably, a divergence persists between strong MACD and oversold oscillators versus the intraday buyer activity, while the closing near the session low adds to a cautious technical stance.
Sideways movement expected as breakout odds remain low
Over the next several sessions, NG is expected to trade within a volatility band of GBX1,119 to GBX1,157. Model probabilities assign a 29% chance to an upward break and a 71% probability to a downward move. The primary scenario favors continued sideways movement within the current corridor, with any bullish breakout likely needing to clear the Ichimoku Kijun resistance. If support breaks, further losses are anticipated as the bearish scenario.
Earlier, analysts noted that broader equity markets were expected to remain volatile and that targeted sector opportunities might be more resilient than broad market recoveries. In light of National Grid's current technical posture, traders should monitor for any decisive move above the Ichimoku Kijun resistance at GBX1,148, as this could signal the beginning of a stronger reversal from the prevailing sideways-to-bearish setup.










-
 Afghanistan
-
 Albania
-
 Algeria
-
 Angola
-
 Argentina
-
 Armenia
-
 Australia
-
 Austria
-
 Azerbaijan
-
 Bahamas
-
 Bahrain
-
 Bangladesh
-
 Belarus
-
 Belgium
-
 Bolivia
-
 Botswana
-
 Brazil
-
 Brunei
-
 Bulgaria
-
 Cambodia
-
 Cameroon
-
 Canada
-
 Chile
-
 China
-
 Colombia
-
 Congo
-
 Costa Rica
-
 Cote d'Ivoire
-
 Croatia
-
 Cuba
-
 Cyprus
-
 Czechia
-
 DR Congo
-
 Denmark
-
 Dominican Republic
-
 Ecuador
-
 Egypt
-
 El Salvador
-
 Estonia
-
 Eswatini
-
 Ethiopia
-
 Finland
-
 France
-
 Georgia
-
 Germany
-
 Ghana
-
 Greece
-
 Haiti
-
 Hong Kong
-
 Hungary
-
 India
-
 Indonesia
-
 Iran, Islamic republic
-
 Iraq
-
 Ireland
-
 Israel
-
 Italy
-
 Jamaica
-
 Japan
-
 Jordan
-
 Kazakhstan
-
 Kenya
-
 Korea
-
 Kuwait
-
 Kyrgyzstan
-
 Laos
-
 Latvia
-
 Lebanon
-
 Lesotho
-
 Libya
-
 Lithuania
-
 Luxembourg
-
 Madagascar
-
 Malaysia
-
 Malta
-
 Mauritius
-
 Mexico
-
 Moldova
-
 Mongolia
-
 Montenegro
-
 Morocco
-
 Mozambique
-
 Myanmar
-
 Namibia
-
 Nepal
-
 Netherlands
-
 New Zealand
-
 Nigeria
-
 North Macedonia
-
 Norway
-
 Oman
-
 Pakistan
-
 Palestine
-
 Panama
-
 Papua New Guinea
-
 Paraguay
-
 Peru
-
 Philippines
-
 Poland
-
 Portugal
-
 Puerto Rico
-
 Qatar
-
 Reunion
-
 Romania
-
 Rwanda
-
 Saudi Arabia
-
 Serbia
-
 Singapore
-
 Slovakia
-
 Slovenia
-
 Somalia
-
 South Africa
-
 Spain
-
 Sri Lanka
-
 Sweden
-
 Switzerland
-
 Syria
-
 Taiwan
-
 Tajikistan
-
 Tanzania
-
 Thailand
-
 Trinidad and Tobago
-
 Tunisia
-
 Turkey
-
 UAE
-
 Uganda
-
 Ukraine
-
 United Kingdom
-
United States
-
 Uruguay
-
 Uzbekistan
-
 Venezuela
-
 Vietnam
-
 Yemen
-
 Zambia
-
 Zimbabwe
- Forex
- Crypto












