

Why is Adobe stock down today? Fiscal Q3 2026 report weighs, seller pressure in focus

Adobe Inc. (ADBE) stock is trading at $228.63, down 3.99% today and lingering near the session’s low in a moderately volatile environment. The price remains below its key moving averages, indicating ongoing seller pressure.
 257.14
262.26
Highlights
- Adobe stock fell 16.4% over the past month after fiscal Q3 2026 disclosures shifted investor expectations for near-term performance.
- The Q3 2026 report drove a recalibration of operational outlook, with pronounced investor sensitivity to company results in the current market.
- ADBE trades below major moving averages and faces persistent seller pressure, with a projected 2 to 3 day range of $223.44 to $238.73 and a 70% probability of further downside.
Earnings report triggers selloff as investors reassess outlook
Adobe’s fiscal Q3 2026 report, released on September 10, was the primary driver of the recent selloff, as the company’s new financial disclosures shifted investor perceptions of its near-term prospects, according to Finance Yahoo. This event precipitated a 16.4% decline in the stock over the past month, reflecting a recalibration of expectations around operational performance. Ongoing sensitivity to company results remains heightened in the current environment.
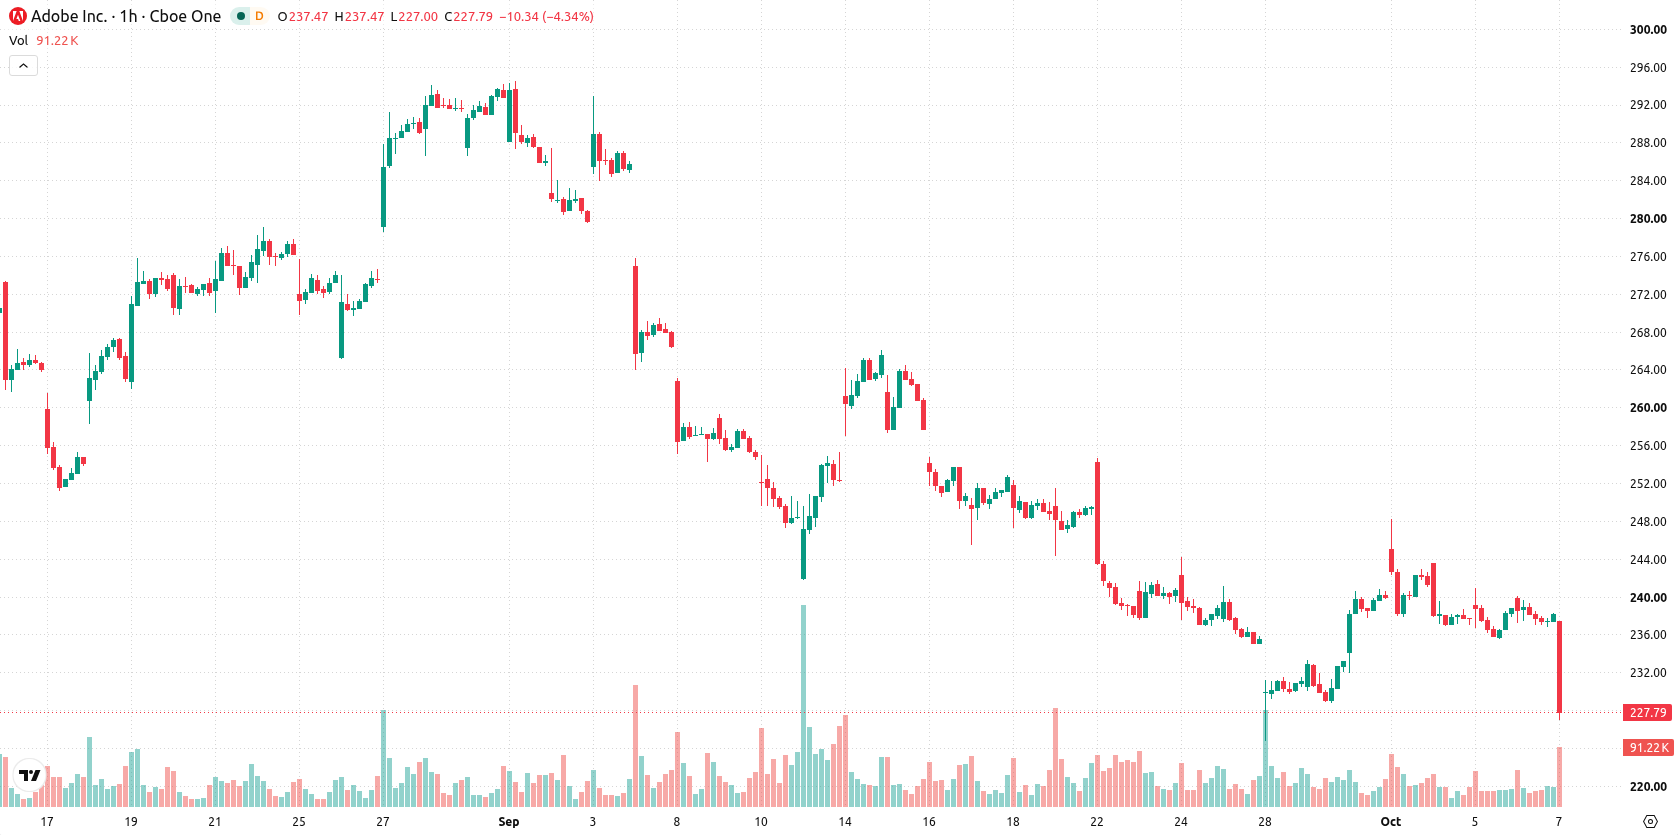
Mixed momentum signals as price stalls below moving averages
On the h1 chart, ADBE is trading below the MA-20 at $237.73, the MA-50 at $236.44, and the longer-term MA-200 at $258.72. The Ichimoku Kijun level at $239.72 forms immediate resistance. Momentum signals are mixed: MACD currently shows strong buy momentum, while ADX and CCI readings are neutral. Both RSI and Stoch RSI provide buy signals, whereas Bull/Bear Power highlights strong intraday buyer dominance and the Awesome Oscillator suggests a sell, pointing to divergence among oscillators.
Range-bound outlook as breakout hinges on resistance breach
In the short term, the projected price range for ADBE is $223.44 to $238.73 over the next two to three trading days, representing a typical volatility band relative to current levels. There is a 70% probability of a downward move and a 30% chance of an upward reversal. The baseline scenario suggests price activity will remain in a sideways corridor, with bullish prospects tied to a breakout above the Ichimoku Kijun resistance and downside risks centered on a decline below the range’s lower bound.
Earlier, analysts noted a period of consolidation for Adobe stock as technical signals pointed to a balanced outlook. The recent selloff and break below key moving averages now add downside risk, with the immediate focus on whether prices can hold above the projected lower bound of the current trading range.









-
 Afghanistan
-
 Albania
-
 Algeria
-
 Angola
-
 Argentina
-
 Armenia
-
 Australia
-
 Austria
-
 Azerbaijan
-
 Bahamas
-
 Bahrain
-
 Bangladesh
-
 Belarus
-
 Belgium
-
 Bolivia
-
 Botswana
-
 Brazil
-
 Brunei
-
 Bulgaria
-
 Cambodia
-
 Cameroon
-
 Canada
-
 Chile
-
 China
-
 Colombia
-
 Congo
-
 Costa Rica
-
 Cote d'Ivoire
-
 Croatia
-
 Cuba
-
 Cyprus
-
 Czechia
-
 DR Congo
-
 Denmark
-
 Dominican Republic
-
 Ecuador
-
 Egypt
-
 El Salvador
-
 Estonia
-
 Eswatini
-
 Ethiopia
-
 Finland
-
 France
-
 Georgia
-
 Germany
-
 Ghana
-
 Greece
-
 Haiti
-
 Hong Kong
-
 Hungary
-
 India
-
 Indonesia
-
 Iran, Islamic republic
-
 Iraq
-
 Ireland
-
 Israel
-
 Italy
-
 Jamaica
-
 Japan
-
 Jordan
-
 Kazakhstan
-
 Kenya
-
 Korea
-
 Kuwait
-
 Kyrgyzstan
-
 Laos
-
 Latvia
-
 Lebanon
-
 Lesotho
-
 Libya
-
 Lithuania
-
 Luxembourg
-
 Madagascar
-
 Malaysia
-
 Malta
-
 Mauritius
-
 Mexico
-
 Moldova
-
 Mongolia
-
 Montenegro
-
 Morocco
-
 Mozambique
-
 Myanmar
-
 Namibia
-
 Nepal
-
 Netherlands
-
 New Zealand
-
 Nigeria
-
 North Macedonia
-
 Norway
-
 Oman
-
 Pakistan
-
 Palestine
-
 Panama
-
 Papua New Guinea
-
 Paraguay
-
 Peru
-
 Philippines
-
 Poland
-
 Portugal
-
 Puerto Rico
-
 Qatar
-
 Reunion
-
 Romania
-
 Rwanda
-
 Saudi Arabia
-
 Serbia
-
 Singapore
-
 Slovakia
-
 Slovenia
-
 Somalia
-
 South Africa
-
 Spain
-
 Sri Lanka
-
 Sweden
-
 Switzerland
-
 Syria
-
 Taiwan
-
 Tajikistan
-
 Tanzania
-
 Thailand
-
 Trinidad and Tobago
-
 Tunisia
-
 Turkey
-
 UAE
-
 Uganda
-
 Ukraine
-
 United Kingdom
-
United States
-
 Uruguay
-
 Uzbekistan
-
 Venezuela
-
 Vietnam
-
 Yemen
-
 Zambia
-
 Zimbabwe
- Forex
- Crypto












