

$3.2 billion crude asset acquisitions support Enbridge stock at C$65.14 support

Enbridge Inc. (ENB) stock is trading at C$65.74 after a modest decline during the latest session. The price remains below its key moving averages, reflecting continued softness in the short-, medium-, and long-term outlook.
 68.30
69.33
Highlights
- Enbridge reported FY2025 earnings attributable to controlling interests of CAD 7.49 billion before preference-share dividends, confirming profitability for the period.
- Management is undertaking CAD 3.2 billion in crude acquisitions and maintaining a 4.5x to 5.0x debt to EBITDA target, focusing on asset growth with disciplined leverage.
- Shares of Enbridge trade below key moving averages with a high probability of further downside, projected between C$65.14 and C$66.65.
Profitability and leverage targets reinforce stability amid asset expansion
Enbridge reported FY2025 earnings attributable to controlling interests of CAD 7.49 billion for the year ended December 31, 2025, before preference-share dividends, confirming its recent period profitability and operating strength, according to Kalkine. This earnings outcome provides markets with a reference point for financial stability and shapes expectations around future cash flow distributions. In parallel, the company is progressing with $3.2 billion in crude acquisitions while maintaining a 4.5x to 5.0x debt/EBITDA target, signaling both asset growth and an emphasis on prudent leverage. Upcoming scheduled earnings on November 6, 2026, as reported by Finance Yahoo, remain a focal point for further investor attention.
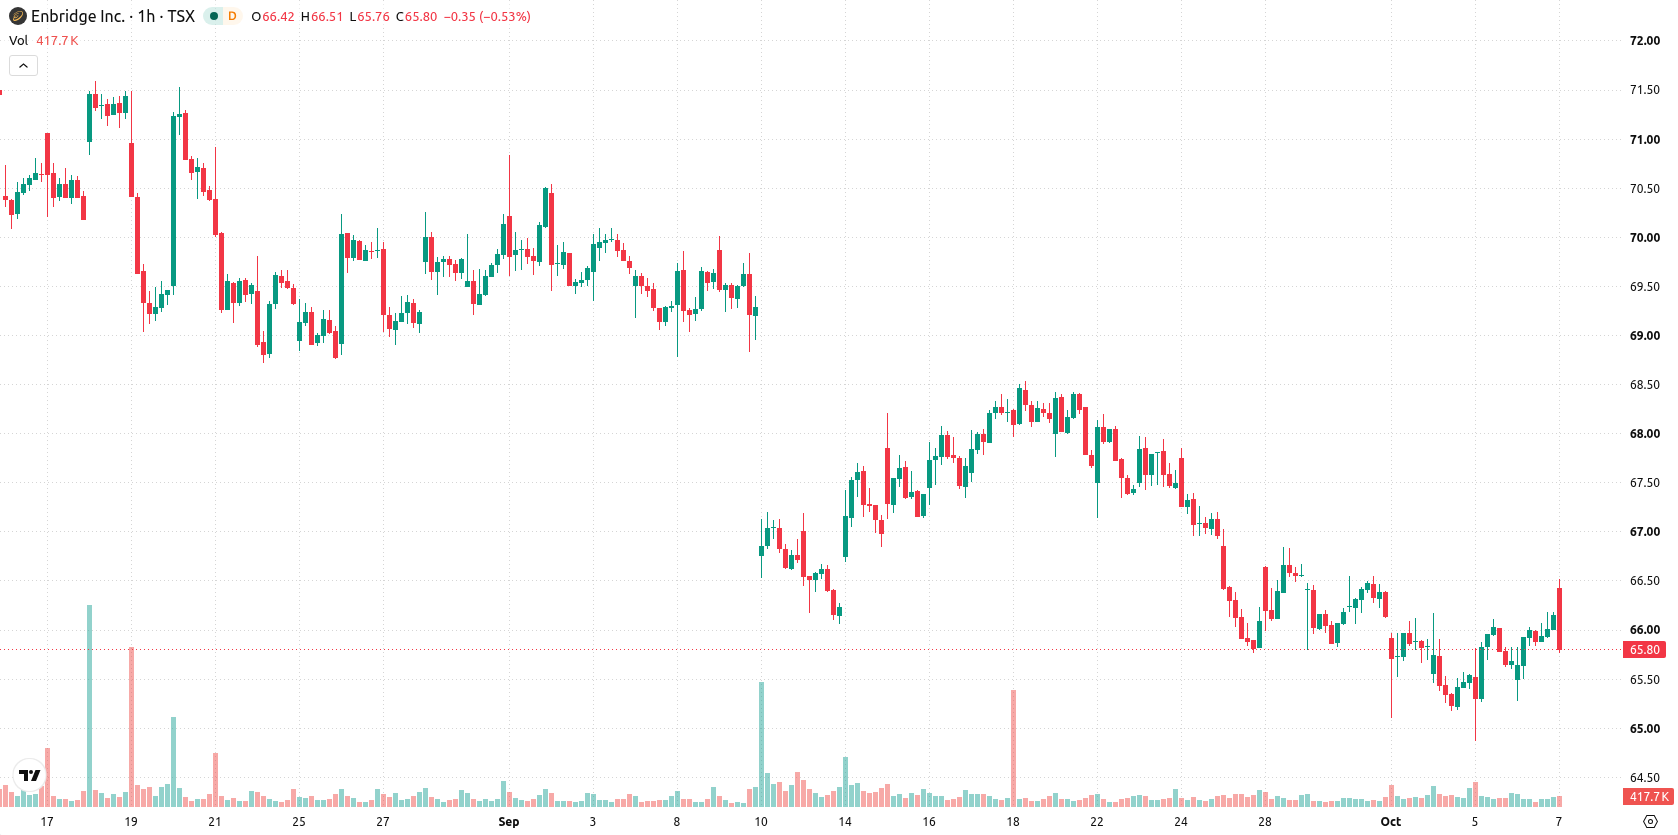
Support levels and indicator divergence signal momentum uncertainty
ENB/CAD is trading below the MA-20 (C$65.75), MA-50 (C$65.98), and MA-200 (C$72.28) levels, with the Ichimoku Kijun at C$65.69 acting as the nearest support. Momentum indicators present a mixed picture: RSI currently signals Buy, while both CCI and Stochastic RSI are in overbought territory. Bull/Bear Power also reflects overbought conditions, suggesting buyers were recently dominant on an intraday basis. ADX signals Sell, MACD remains Neutral, and the Awesome Oscillator supports ongoing upward momentum. This technical setup reveals a clear divergence between price movement and several indicators.
Limited breakout odds as range persists and downside risk rises
In the short term, ENB/CAD is expected to remain range-bound between C$65.14 and C$66.65, representing the typical volatility band relative to current levels. The probability of an upward breakout is seen as very low, while downside risk remains pronounced given recent price action and indicator divergence. If the upper band at C$66.65 is breached, further upside momentum could develop. Conversely, a move below C$65.14 would reinforce the existing downtrend and may trigger additional weakness.
Earlier, analysts noted that Enbridge stock was experiencing ongoing technical weakness and a lack of clear upward momentum ahead of upcoming earnings releases. The current analysis adds a new dimension by highlighting indicator divergence and renewed overbought signals, suggesting that traders should watch for a potential shift if either C$66.65 resistance or C$65.14 support is breached in the near term.






Latest Enbridge News





-
 Afghanistan
-
 Albania
-
 Algeria
-
 Angola
-
 Argentina
-
 Armenia
-
 Australia
-
 Austria
-
 Azerbaijan
-
 Bahamas
-
 Bahrain
-
 Bangladesh
-
 Belarus
-
 Belgium
-
 Bolivia
-
 Botswana
-
 Brazil
-
 Brunei
-
 Bulgaria
-
 Cambodia
-
 Cameroon
-
 Canada
-
 Chile
-
 China
-
 Colombia
-
 Congo
-
 Costa Rica
-
 Cote d'Ivoire
-
 Croatia
-
 Cuba
-
 Cyprus
-
 Czechia
-
 DR Congo
-
 Denmark
-
 Dominican Republic
-
 Ecuador
-
 Egypt
-
 El Salvador
-
 Estonia
-
 Eswatini
-
 Ethiopia
-
 Finland
-
 France
-
 Georgia
-
 Germany
-
 Ghana
-
 Greece
-
 Haiti
-
 Hong Kong
-
 Hungary
-
 India
-
 Indonesia
-
 Iran, Islamic republic
-
 Iraq
-
 Ireland
-
 Israel
-
 Italy
-
 Jamaica
-
 Japan
-
 Jordan
-
 Kazakhstan
-
 Kenya
-
 Korea
-
 Kuwait
-
 Kyrgyzstan
-
 Laos
-
 Latvia
-
 Lebanon
-
 Lesotho
-
 Libya
-
 Lithuania
-
 Luxembourg
-
 Madagascar
-
 Malaysia
-
 Malta
-
 Mauritius
-
 Mexico
-
 Moldova
-
 Mongolia
-
 Montenegro
-
 Morocco
-
 Mozambique
-
 Myanmar
-
 Namibia
-
 Nepal
-
 Netherlands
-
 New Zealand
-
 Nigeria
-
 North Macedonia
-
 Norway
-
 Oman
-
 Pakistan
-
 Palestine
-
 Panama
-
 Papua New Guinea
-
 Paraguay
-
 Peru
-
 Philippines
-
 Poland
-
 Portugal
-
 Puerto Rico
-
 Qatar
-
 Reunion
-
 Romania
-
 Rwanda
-
 Saudi Arabia
-
 Serbia
-
 Singapore
-
 Slovakia
-
 Slovenia
-
 Somalia
-
 South Africa
-
 Spain
-
 Sri Lanka
-
 Sweden
-
 Switzerland
-
 Syria
-
 Taiwan
-
 Tajikistan
-
 Tanzania
-
 Thailand
-
 Trinidad and Tobago
-
 Tunisia
-
 Turkey
-
 UAE
-
 Uganda
-
 Ukraine
-
 United Kingdom
-
United States
-
 Uruguay
-
 Uzbekistan
-
 Venezuela
-
 Vietnam
-
 Yemen
-
 Zambia
-
 Zimbabwe
- Forex
- Crypto












